
Beschreibung
Dot Momentum %BB Dynamischer Visualisierer für cTrader
Volatilität quantifizieren. Momentum visualisieren. Ihre Einstiege meistern.
Entfesseln Sie die Kraft der Volatilität mit dem Bollinger Bands %B Dynamischen Visualisierer, einem einzigartigen benutzerdefinierten Indikator für cTrader, der Ihnen unvergleichliche Einblicke in die Kursbewegung im Verhältnis zu ihrem Volatilitätsbereich bietet. Über die traditionellen Bollinger-Bänder hinausgehend, verwandelt dieser Indikator komplexe Volatilitätsmetriken in einen intuitiven, farbcodierten Strom von Kreisen, der Ihnen hilft, entscheidende Wendepunkte und Trendstärken im Markt zu erkennen.
Was ist Bollinger Bands %B und wie unterscheidet es sich?
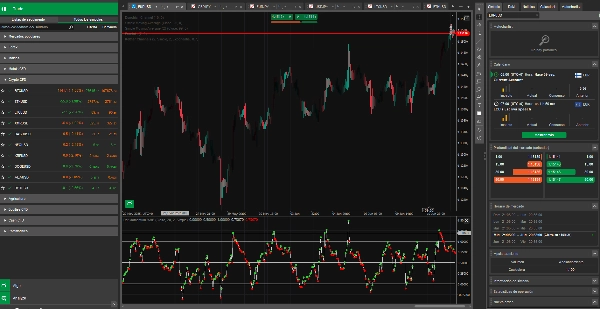
Während Standard-Bollinger-Bänder direkt auf Ihrem Kurschart überlagert werden und dynamische Unterstützung/Widerstand anzeigen sowie die Marktvolatilität durch ihre Ausdehnung und Kontraktion visuell darstellen, ist das Bollinger Bands %B ein Oszillator. Es wird in einem separaten Fenster unter Ihrem Hauptchart angezeigt und bietet eine quantifizierbare Messgröße, wo sich der aktuelle Kurs innerhalb des Bollinger-Band-Bereichs befindet.
Es zeigt Ihnen den Kurs nicht direkt an; stattdessen offenbart es die relative Position des Kurses auf einer Skala von 0 bis 1:
- 0.0: Kurs befindet sich am unteren Bollinger-Band.
- 0.5: Kurs befindet sich am mittleren Bollinger-Band (dem gleitenden Durchschnitt).
- 1.0: Kurs befindet sich am oberen Bollinger-Band.
Vorteile & Volatilitätskontext:
Dieser Indikator geht über bloße Beobachtung hinaus. Er quantifiziert die Position des Kurses relativ zu seiner inhärenten Volatilität, sodass Sie:
- Trendstärke messen: Ein anhaltendes %B über 0,5 deutet auf starkes Aufwärtsmomentum hin, während Werte unter 0,5 auf Abwärtsdruck hinweisen.
- Potenzielle Umkehrungen erkennen: Extreme Werte (nahe 0,0 oder 1,0) können signalisieren, dass der Kurs innerhalb seines aktuellen Volatilitätsbereichs überdehnt ist.
- Kontextuelle Volatilität verstehen: Die Volatilität selbst (dargestellt durch die Breite der zugrundeliegenden Bollinger-Bänder) ist stets kontextabhängig für den von Ihnen betrachteten Zeitrahmen. Ein %B-Wert auf einem 1-Stunden-Chart spiegelt die Volatilität anders wider als auf einem 1-Tages-Chart. Unser Indikator passt sich nahtlos an Ihren gewählten Zeitrahmen an und liefert relevante Einblicke.
Technische Merkmale:
- Präzise Berechnung: %B wird berechnet als: (Aktueller Kurs−Unteres Band)/(Oberes Band−Unteres Band)
- Dynamische Farbgebung (Kreise):
-
- Limettengrüne Kreise: Zeigen an, dass der %B-Wert im Vergleich zum vorherigen Balken steigt und ein Aufwärtsmomentum signalisiert.
- Rote Kreise: Zeigen an, dass der %B-Wert im Vergleich zum vorherigen Balken fällt und ein Abwärtsmomentum signalisiert.
- Silberne Kreise: Werden angezeigt, wenn der %B-Wert unverändert bleibt oder für den allerersten gültigen Punkt.
- Feine Pfadlinie: Eine dünne, hellgraue Linie verfolgt dezent den Gesamtverlauf des %B-Werts und sorgt für visuelle Kontinuität unter den dynamischen Kreisen.
- Diskrete Level-Marker: Dunkelgraue, durchgezogene Linien bei 0,0, 0,5 und 1,0 (leicht sichtbar, ohne die Hauptvisualisierung zu überlagern) bieten klare Referenzpunkte für Volatilitätsspitzen und den Mittelwert.
- Anpassbar: Passen Sie die Periode der Bollinger-Bänder, Standardabweichungen und den MA-Typ direkt in den Einstellungen an.
Vereinfachte Erklärung: Über-Volatilitäts-Signale (Wie ein RSI für Volatilität!)
Betrachten Sie diesen Indikator wie einen RSI, aber für Volatilitätsüberdehnung statt einfacher überkaufter/überverkaufter Kursniveaus.
- Wenn die Kreise 0,0 berühren oder unterschreiten, bedeutet dies, dass der Kurs stark gegen das untere Ende seines aktuellen Volatilitätsbereichs drückt. Dies ist wie ein "Volatilitäts-Überverkauft"-Signal, das darauf hindeutet, dass der Markt innerhalb seines aktuellen Kontexts nach unten überdehnt sein könnte.
- Wenn die Kreise 1,0 berühren oder überschreiten, bedeutet dies, dass der Kurs stark gegen das obere Ende seines aktuellen Volatilitätsbereichs drückt. Dies ist wie ein "Volatilitäts-Überkauft"-Signal, das darauf hindeutet, dass der Markt innerhalb seines aktuellen Kontexts nach oben überdehnt sein könnte.
Diese extremen Werte bedeuten nicht unbedingt sofort "Kaufen" oder "Verkaufen", aber sie sind starke Warnsignale, dass sich der Markt an einem Extrempunkt innerhalb seiner typischen Bewegungsspanne für diesen spezifischen Zeitrahmen befindet. Dies geht oft einer potenziellen Mittelwertumkehr oder einer Veränderung im Volatilitätsverhalten des Marktes voraus.
Zusammenfassung
Kundenbewertungen
5 | 0 % | |
4 | 100 % | |
3 | 0 % | |
2 | 0 % | |
1 | 0 % |


