Descripción
Detector de Sesgo HTF — Edición Panel
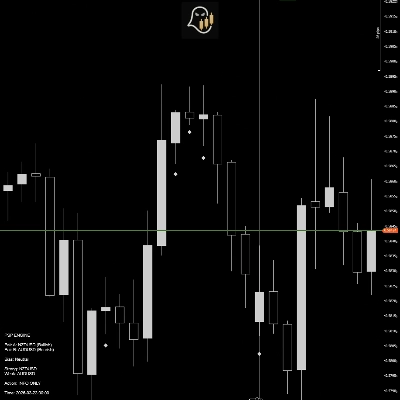
Vea la historia del marco temporal superior de un vistazo. HTF Bias Detector representa las últimas N velas de marcos temporales superiores en un panel flotante directamente en su gráfico — sin necesidad de cambiar de marco temporal — y automáticamente identifica el sesgo dominante usando cuatro patrones institucionales de acción del precio.
Cómo Funciona
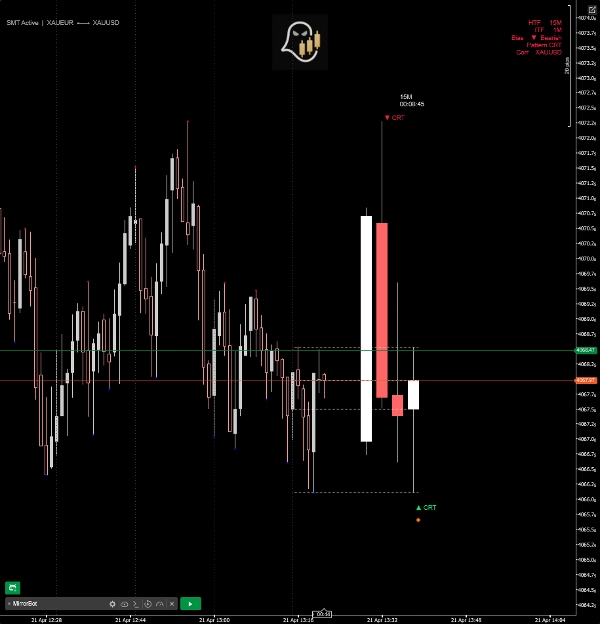
El indicador asigna el marco temporal actual de su gráfico a su marco temporal superior natural (por ejemplo, 5M → 1H, 1H → Diario) y dibuja esas velas HTF en un panel limpio anclado a la derecha del precio. La detección de patrones se ejecuta en esas velas en tiempo real.
Patrones Detectados
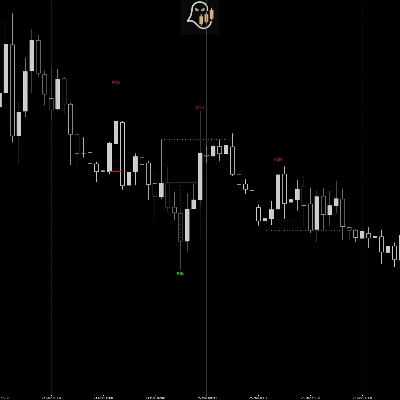
- CRT (Teoría del Rango de Velas) — identifica velas trampa que barren un máximo o mínimo previo y cierran de nuevo dentro, señalando una probable reversión.
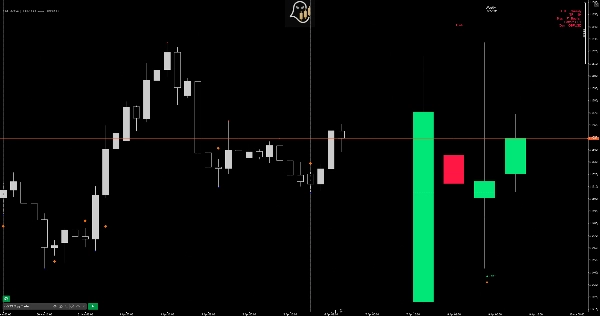
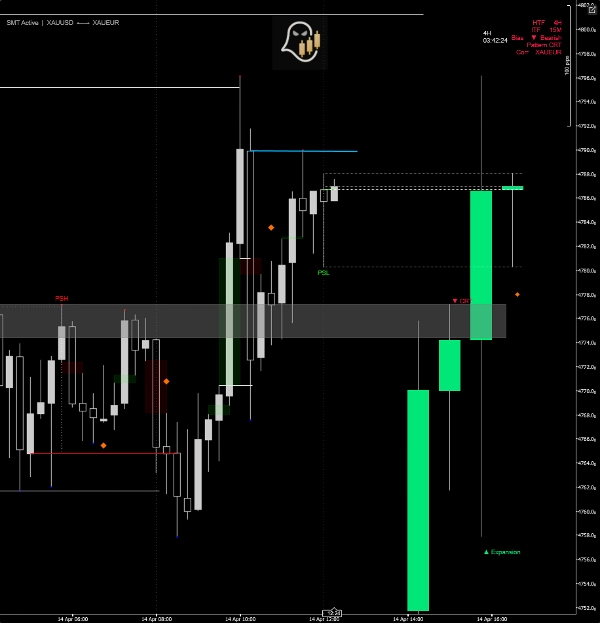
- Expansión — marca velas que engullen completamente el rango previo y cierran más allá de él, confirmando el impulso direccional.
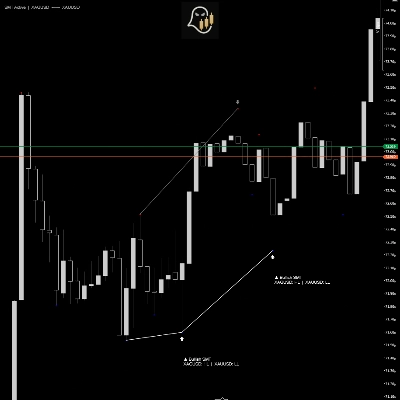
- Punto de Giro — detecta secuencias de tres velas donde una vela de desplazamiento es seguida por una fuerte reversión, marcando un punto estructural de inflexión.
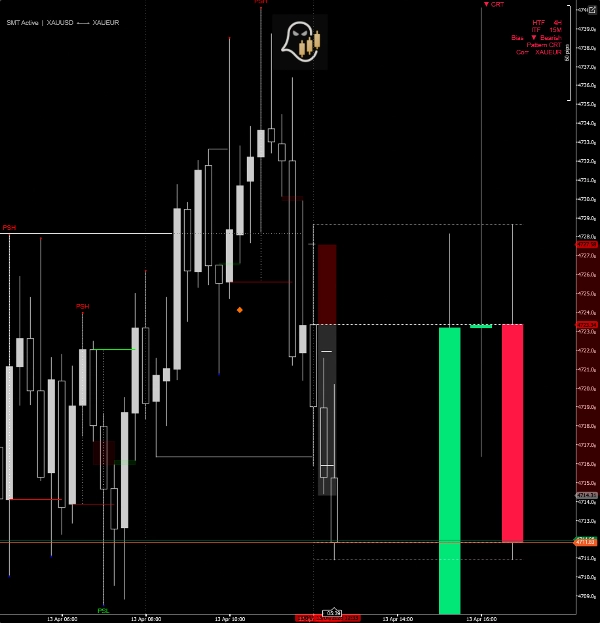
- PSP (Punto de Giro de Precisión) — señal de divergencia entre pares. Cuando el símbolo principal y su par correlacionado imprimen velas direccionales opuestas en la misma barra HTF, se traza un diamante PSP.
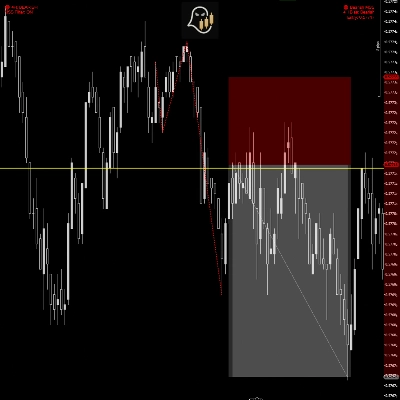
Divergencia SMT (Panel HTF)
Compara pares consecutivos de velas HTF entre instrumentos correlacionados. Cuando un par hace un mínimo más bajo mientras el otro hace un mínimo más alto (o viceversa en máximos), se dibuja una línea de divergencia SMT directamente en el panel con una etiqueta direccional.
Detección Automática de Par Correlacionado
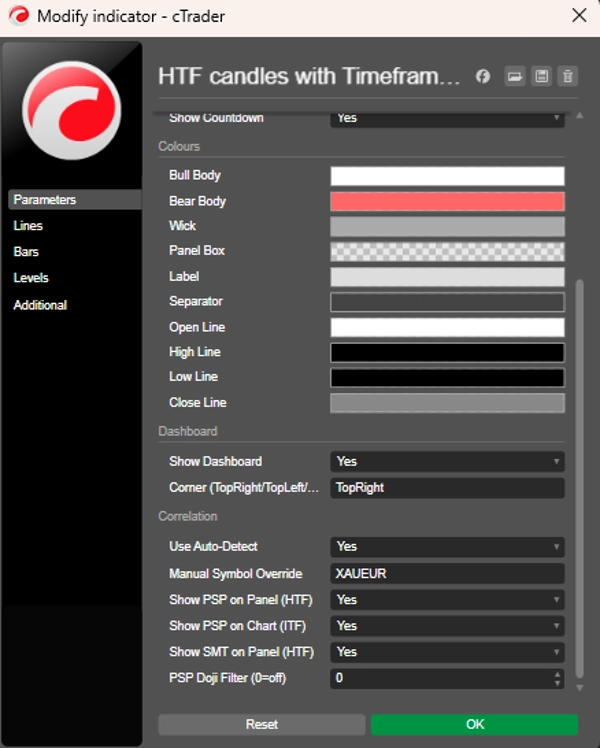
Resuelve automáticamente el instrumento correlacionado para el símbolo de su gráfico — cubriendo pares principales de forex, metales, índices y criptomonedas. También está disponible una anulación manual para emparejamientos personalizados o nombres de símbolos específicos de corredores.
Características Adicionales
- Temporizador de cuenta regresiva en vivo para el cierre de la próxima vela HTF
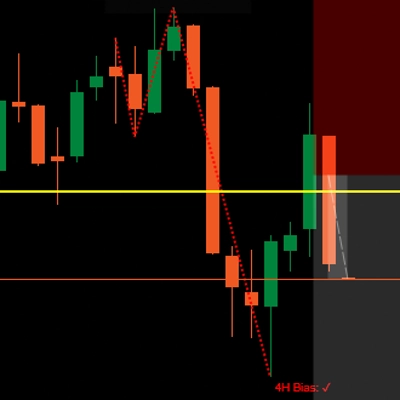
- Líneas de referencia punteadas OHLC para la vela HTF actualmente en formación
- Separadores verticales en el gráfico en vivo alineados con los horarios de apertura HTF
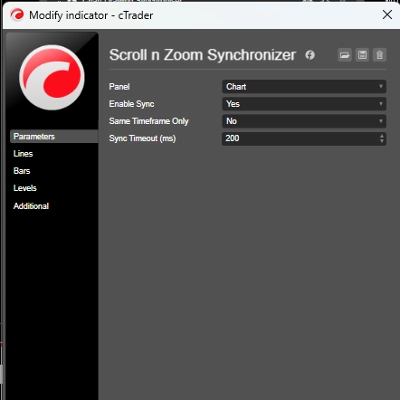
- Panel compacto que muestra HTF, ITF, sesgo detectado, nombre del patrón y par correlacionado
- Diamantes PSP ITF trazados directamente en las barras del gráfico (marco temporal actual)
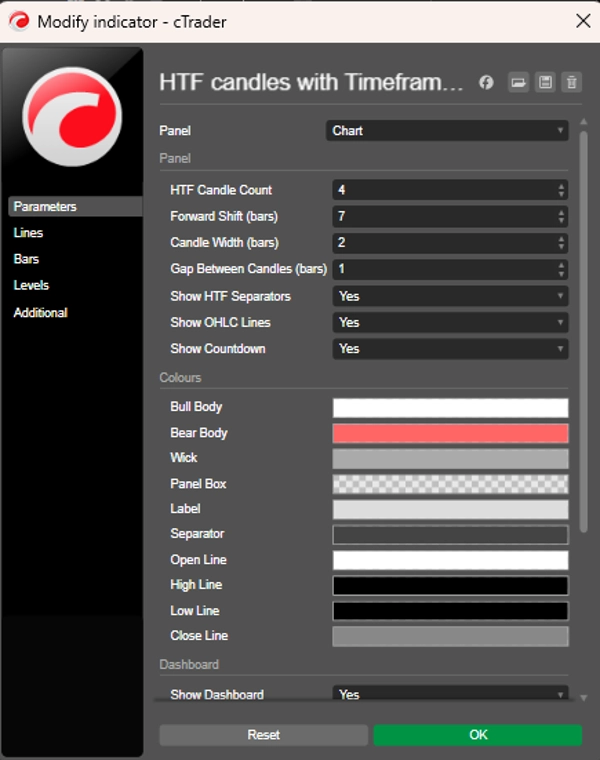
- Colores, ancho del panel, cantidad de velas y posicionamiento totalmente personalizables
- Filtro Doji para suprimir señales PSP débiles
Mapa de Marcos Temporales
Gráfico TF Panel HTF
1M – 4M 15M
5M – 10M 1H
15M – 30M 4H
1H Diario
4H Semanal
Diario Mensual
Resumen
Valoraciones de clientes
5 | 50 % | |
4 | 50 % | |
3 | 0 % | |
2 | 0 % | |
1 | 0 % |