
Descripción
⚠️Actualización disfruta información de profundidad real⚠️
🔥 PANEL DE MAPA DE CALOR 📈
Un terminal institucional de flujo de órdenes y momentum para cTrader.
El Panel de Mapa de Calor no es solo una superposición básica de gráficos, es un ecosistema de trading de tres partes integrado directamente en tu plataforma. Te ofrece visión de "rayos X" en la liquidez del mercado, promedios ponderados por volumen reales y tendencias a nivel macro, todo sin ralentizar tu computadora. ⚡
🎯 Qué Hace (La Vista del Trader)
El sistema descompone tu trading en tres pasos simples:
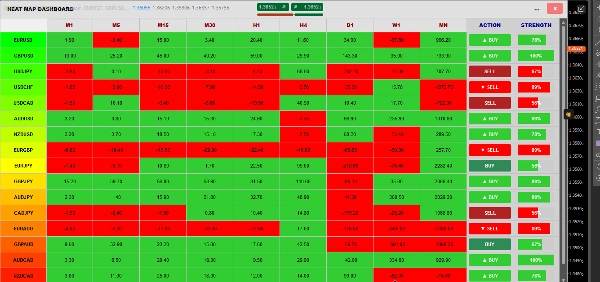
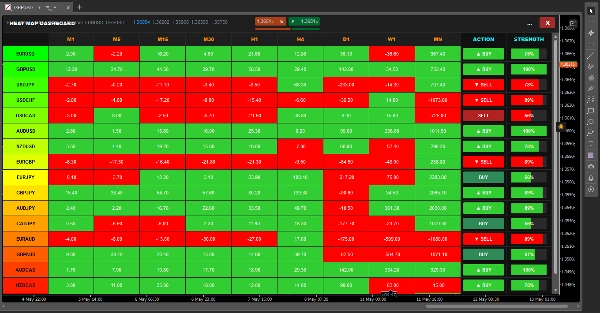
- 🎛️ Paso 1: QUÉ comerciar (La Matriz). En lugar de hacer clic en docenas de gráficos, el panel escanea 17 activos diferentes en 9 marcos temporales (M1 a Mensual). Calcula el momentum para cada celda y lo codifica por colores. De un vistazo, sabes exactamente qué par está en una tendencia masiva y listo para comerciar.
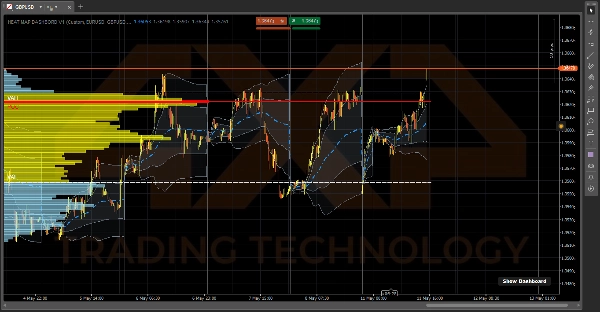
- 🌊 Paso 2: QUIÉN está en control (El VWAP). Una vez que eliges un par, mira el VWAP Anclado Diario. Te muestra el precio promedio verdadero basado en volumen, no solo en velas. Las nubes sombreadas de Desviación Estándar actúan como soporte/resistencia dinámicos, mostrándote exactamente cuándo el mercado está fuertemente sobrecomprado o sobrevendido.
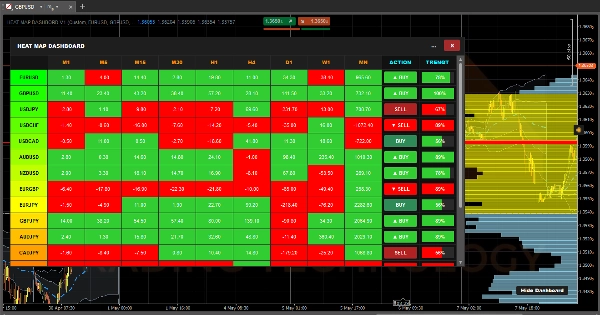
- 📊 Paso 3: DÓNDE entrar (El VRVP). Finalmente, el Perfil de Volumen de Rango Visible mapea exactamente dónde descansa la liquidez institucional pesada. Dibuja automáticamente tu Punto de Control (POC) y las líneas del 70% Área de Valor (VAH y VAL), dándote niveles precisos para ejecutar tus entradas y salidas.
⚙️ Cómo Funciona (Bajo el Capó)
La mayoría de los indicadores que intentan hacer tanta matemática congelarán instantáneamente tu plataforma y harán que cTrader use el 100% de la CPU. Para evitar eso, el Panel de Mapa de Calor está impulsado por tres motores altamente optimizados e independientes que funcionan simultáneamente:
1. El Motor del Panel (El Latido de 2 Segundos) ⏱️ Si calculáramos 153 combinaciones (17 pares x 9 marcos temporales) en cada tick de precio, tu computadora se derretiría. En cambio, este motor funciona con un estricto temporizador de latido de 2 segundos. Cada 2 segundos, mira silenciosamente el precio de hace 14 velas, lo compara con el precio actual y pinta la celda de verde (momentum positivo) o rojo (momentum negativo).
2. El Motor VRVP (El Lector de Pantalla) 🖥️ En lugar de cargar miles de barras de datos históricos, el Perfil de Volumen actúa como un "Oyente de Vista" dinámico. Solo se activa cuando haces zoom o desplazas físicamente tu gráfico. Pregunta a cTrader exactamente qué velas están visibles en tu pantalla, calcula la superposición exacta de volumen para esas barras específicas y redibuja instantáneamente el Área de Valor del 70%.
3. El Motor VWAP (El Acumulador de Ticks) 🧮 El VWAP es lo único que calcula en el tick en vivo. Sin embargo, para mantenerlo rapidísimo, usa una "Serie de Datos Acumulativa" ligera. En lugar de recalcular todo el día cada segundo, simplemente añade el volumen del nuevo tick a un total en segundo plano y se limpia automáticamente en el milisegundo exacto en que el reloj marca la medianoche.
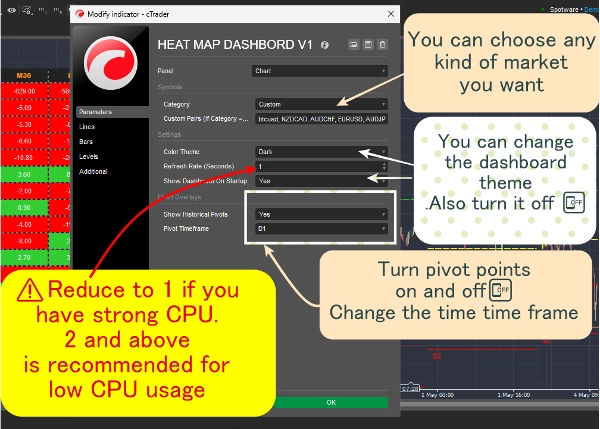
4. El Gestor de Ventanas (El Cambiaformas) 🪟 El panel está envuelto en una lógica personalizada de tamaño en C# que escucha activamente tu monitor. Cuando presionas el Maximizar [ ] o Restaurar [=] botones, el indicador lee dinámicamente tu Chart.Width y Chart.Height en tiempo real, transformándose instantáneamente para ajustarse perfectamente a tu pantalla sin colapsar.
Resumen
1. Market Momentum Matrix: Scans 17 assets across 9 timeframes (from 1 minute to monthly), calculating and color-coding momentum to identify trending pairs quickly.
2. Daily Anchored Volume Weighted Average Price (VWAP): Displays true average prices weighted by volume, with dynamic standard deviation clouds indicating overbought or oversold conditions.
3. Visible Range Volume Profile (VRVP): Maps institutional liquidity by highlighting the Point of Control (POC) and 70% Value Area (VAH & VAL) within the visible chart range, aiding precise entry and exit levels.
The dashboard operates via four optimized engines: a 2-second heartbeat engine for momentum updates, a viewport-driven VRVP engine for volume profile recalculations, a tick-accumulating VWAP engine for real-time volume-weighted pricing, and a dynamic window manager that adjusts the interface to fit the chart size. This architecture ensures efficient performance and real-time responsiveness. The indicator supports visualization, signals (including trend strength, breakouts, and reversals), and filtering based on tick data, volume, and market structure analysis. It is tagged for aggressive trading, market structure, liquidity sweeps, support/resistance, and risk dashboard functionalities.
Valoraciones de clientes
5 | 100 % | |
4 | 0 % | |
3 | 0 % | |
2 | 0 % | |
1 | 0 % |


