present
Zarejestruj się i otrzymaj 50 $ zniżki na pierwszy zakup
Trading product for RSI Velocity Gauge Wskaźnik RSI AI-assisted, image 1
RSI Velocity Gauge
Wskaźnik
102 pobrania
Wersja 1.0, May 2026
Windows, Mac
4.5
Opinie: 2
Trading product for RSI Velocity Gauge Wskaźnik RSI AI-assisted, image 2
Trading product for RSI Velocity Gauge Wskaźnik RSI AI-assisted, image 3
Trading product for RSI Velocity Gauge Wskaźnik RSI AI-assisted, image 4
Trading product for RSI Velocity Gauge Wskaźnik RSI AI-assisted, image 5
33.16K
Wolumen transakcji
25.96K
Zysk w pipsach
10
Sprzedaż
510
Bezpłatne instalacje

Opis

DARMOWE DLA WSZYSTKICH

🏎️ RSI Velocity Gauge Pro 📊

Ostateczny HUD Momentum w Czasie Rzeczywistym i Wizualizator Trendów dla cTrader

Zmień sposób, w jaki postrzegasz momentum rynku dzięki RSI Velocity Gauge Pro. Pożegnaj się z chaotycznymi, oddzielnymi podoknami oscylatorów. Ten premium wskaźnik nakłada elegancką, mechaniczną deskę rozdzielczą bezpośrednio na Twój wykres, dając natychmiastowy, wysokiej jakości odczyt prędkości rynku, siły i punktów wyczerpania.

Zaprojektowany z zaawansowanym trygonometrycznym skalowaniem UI i logiką malowania wykresu na żywo, to coś więcej niż wskaźnik — to kompletne centrum kontroli wykonawczej dla Twojego układu handlowego.

⚡ Kluczowe Funkcje

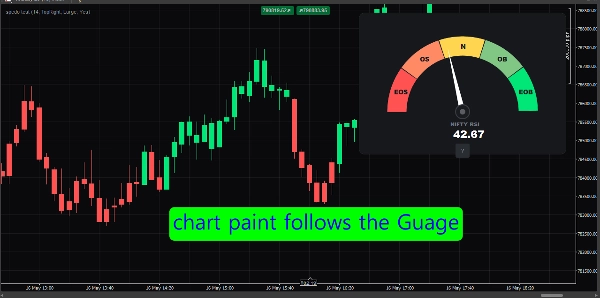
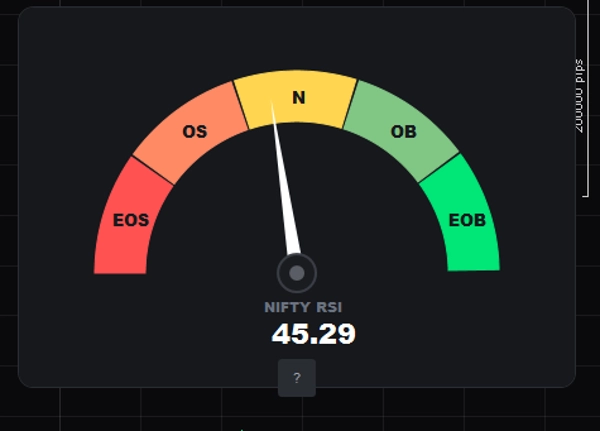
  • 🧭 Dynamiczna Mechaniczna Deska Rozdzielcza: Oszałamiający, ciemny, radialny prędkościomierz, który śledzi Relative Strength Index (RSI) na żywo przy każdym pojedynczym ticku.
  • 🎨 Psychologicznie Poprawne Kodowanie Kolorów: Idealnie odwrócone, aby odpowiadać rzeczywistemu naciskowi rynku. Lewa strona reprezentuje przytłaczającą kontrolę sprzedających (Czerwony/Pomarańczowy), podczas gdy prawa strona pokazuje agresywną prędkość kupujących (Zielony/Mięta).
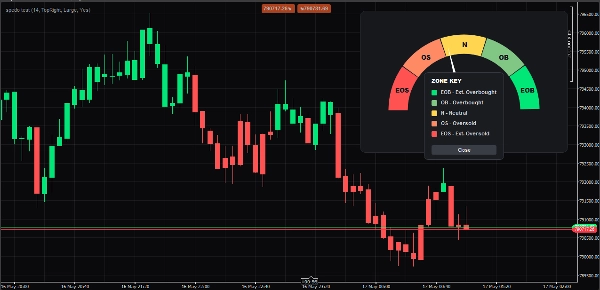
  • 🕯️ Inteligentne Malowanie Świec: Skup wzrok na ruchu cen. Wskaźnik automatycznie maluje świece wykresu na zielono podczas byczego momentum (RSI > 50) i na czerwono podczas niedźwiedziego otoczenia (RSI < 50).
  • 🧠 Interaktywna Legenda Wyskakująca (? Przycisk): Utrzymuj swoje wykresy czyste i minimalistyczne. Kliknij interaktywny okrągły ? przycisk, aby natychmiast przełączyć elegancki, podniesiony klucz strefy z dokładnymi skrótami i odpowiadającymi im kolorami.
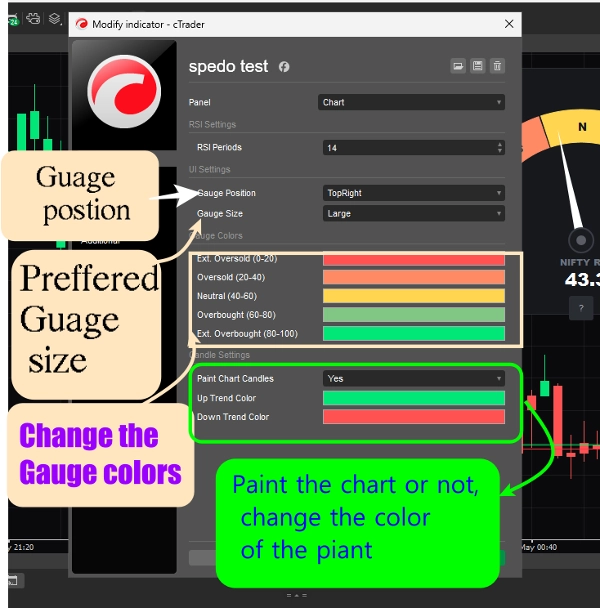
  • 📐 W pełni Responsywne Skalowanie UI: Wybierz między Małym, Średnim lub Dużym widokiem. Wskaźnik dynamicznie oblicza wszystkie geometrie, rozmiary czcionek, marginesy i promienie obramowania, aby idealnie dopasować się do każdej rozdzielczości monitora (w tym 4K).
  • 📍 Płynne Pozycjonowanie w Rogu: Łatwo przesuń wskaźnik z drogi krytycznego ruchu cen. Przełączaj między Górnym Lewym, Górnym Prawym, Dolnym Lewym lub Dolnym Prawym z automatycznymi regulacjami odstępów.
  • 🎛️ Natywne Wybieraki Kolorów: Bez uciążliwych kodów hex! Dostosuj kolor wszystkich 5 stref i świec trendu za pomocą płynnych siatek kolorów cTrader.

🔍 Klucz Legendy Strefy

Kliknij wbudowany ? przycisk na swojej desce rozdzielczej, aby zobaczyć swoje niestandardowe zasady stref:

  • 🟥 EOS (Ekstremalnie Wyprzedany | 0–20): Maksymalne wyczerpanie sprzedaży. Potencjalna strefa odwrócenia.
  • 🟧 OS (Wyprzedany | 20–40): Silna niedźwiedzia prędkość. Niedźwiedzie mają mocną kontrolę.
  • 🟨 N (Neutralny | 40–60): Strefa równowagi rynku. Ruch boczny lub konsolidacja.
  • 🟩 OB (Przekupiony | 60–80): Silna bycza prędkość. Byki mają mocną kontrolę.
  • 🟩 EOB (Ekstremalnie Przekupiony | 80–100): Maksymalne wyczerpanie kupna. Potencjalna strefa cofnięcia.

⚙️ Parametry Konfigurowalne

  • Ustawienia RSI: Łatwo dostosuj okresy obliczeń (Domyślnie: 14).
  • Pozycjonowanie UI: Wybór układu z listy rozwijanej (Górny Lewy, Górny Prawy, Dolny Lewy, Dolny Prawy).
  • Rozmiar UI: Płynne responsywne skalowanie (Mały, Średni, Duży).
  • Kolory Wskaźnika: Niezależne wybieraki palety dla wszystkich 5 pasm momentum.
  • Ustawienia Świec: Globalny przełącznik do włączania/wyłączania malowania tła świec, z niestandardowymi selektorami pędzla trendu Wzrostowego i Spadkowego.

Podsumowanie

AI summary
The RSI Velocity Gauge is a momentum indicator designed for cTrader that overlays a dynamic, mechanical-style dashboard directly on trading charts. It provides real-time tracking of the Relative Strength Index (RSI) on every tick, visualized as a radial speedometer with color-coded zones indicating market momentum and pressure. The gauge uses a dark-mode interface with colors representing seller dominance (red/orange) and buyer dominance (green/mint).

Key features include automatic candle coloring to reflect bullish (green) or bearish (red) momentum based on RSI values, an interactive pop-up legend explaining zone meanings, and fully responsive UI scaling with adjustable sizes (small, medium, large) and corner positioning options. Users can customize RSI calculation periods, gauge colors for five momentum bands, and toggle candle painting on or off.

The indicator divides RSI values into five zones: Extreme Oversold (0–20), Oversold (20–40), Neutral (40–60), Overbought (60–80), and Extreme Overbought (80–100), helping identify potential reversal or exhaustion points. The RSI Velocity Gauge serves as a comprehensive momentum visualization tool, integrating smoothly into trading layouts for enhanced market speed, strength, and trend analysis.
Profil wskaźnika
Kategoria wskaźnika
Dynamika
Typ wyjścia
Wizualizacja
Filtr
Sygnały
Wymagania dotyczące danych
Tylko słupki
Dane tickowe
Wolumen
GłR
Dane zewnętrzne
Obsługiwane sygnały
Zmienność
Siła trendu
Przebicie poziomu
Dotknięcie poziomu
Odwrócenie trendu
Przecięcie
Dywergencja
Przełamanie

Opinie klientów

4.5
Opinie: 2
5
50 %
4
50 %
3
0 %
2
0 %
1
0 %
Opinie klientów
September 10, 2026
RSI Velocity Gauge provides a clear radial RSI HUD, accurate zone mapping, candle coloring and a useful interactive legend. Testing on EURUSD and XAUUSD worked well across M1–D1. The main issue is the incorrect hard-coded “NIFTY RSI” label shown on other symbols; live per-tick updating was not independently verified.
May 21, 2026
Am so happy ☺️☺️ it's free

Dyskusja

Częste pytania
RSI
AI-assisted
Moving Average
Produkty dostępne za pośrednictwem cTrader Store, w tym boty handlowe, wskaźniki i wtyczki, dostarczane są przez deweloperów zewnętrznych i udostępniane wyłącznie w celach informacyjnych oraz w celu zapewnienia dostępu technicznego. cTrader Store nie jest brokerem i nie zapewnia doradztwa inwestycyjnego, nie udziela spersonalizowanych rekomendacji ani nie gwarantuje przyszłych wyników.

Więcej od tego autora

Wskaźnik
Crypto
GBPUSD
+7
GUPPY TREND MASTER V3.. Visualize Market Sentiment with the 38-EMA Rainbow The Guppy Trend Master 4X4 Indicator
Wskaźnik
Market Structure
Stop guessing which trading session you in, with Sessions indicator sessions are in your finger tips like a pro
Wskaźnik
AI-assisted
Tired of staring at the same old charts? The Theme Customizer indicator brings a whole new level of personalization
Wskaźnik
ATR
RSI
+11
This indicator puts three helpful trading tools on your chart at once. Think of it like having three expert traders
Wskaźnik
ATR
EMA
+4
The FULL-MARKET-VIEW-DASHBOARD is a professional-grade trading suite for cTrader that eliminates market noise.
Wskaźnik
Aggressive
Supertrend
+5
Stop trading with tunnel vision! 🚫 The Heat Map Dashboard is an institutional-grade visual trading assistant
cBot
ATR
Channel
+5
3 in 1 Earn While Asleep come with 3 intergraded modes, Scalper mode, Day trader mode and Investor mode
1.4
Współczynnik zysku
Wtyczka desktopowa
Trade Journal
AI Integration
+1
A cTrader plugin displaying monthly/yearly PnL calendar tiles and trading statistics. This is want you need

Możesz także polubić

Wskaźnik
RSI
Buy at green arrow if trend is bullish and viceversa
Wskaźnik
ATR
RSI
+4
RSI bands drawn on price, confluence-scored BUY/SELL signals, an ATR stop with three targets
Wskaźnik
RSI
RSI on the main chart with 45/55 momentum levels, overbought/oversold levels, averaged RSI, and multi-timeframe support.
Wskaźnik
Prop
Forex
+14
🚀See the market’s framework, decide faster. Session-Aware Pivots. Auto Presets. Pro-Grade Zones.🚀
Wskaźnik
Doji
Volume
+5
Instantly spot high-liquidity institutional moves with clean, non-obtrusive triangle alerts on cTrader charts.
Wskaźnik
Prop
Forex
+4
The Smooth Heiken Ashi indicator is a refined charting tool designed to filter out market noise and highlight true price
Wskaźnik
Forex
Enhance your trading strategy with automated detection and alerts for key chart patterns.
Wskaźnik
VWAP
ZigZag
Weis & Wyckoff System v2.0
Wskaźnik
Imbalance
Fair Value Gap
+1
Multi-symbol, multi-timeframe Fair Value Gaps in one panel.
Wskaźnik
ATR
MSS
+3
Stop drawing levels manually. SmartLevels Pro detects, scores & predicts — H4/H1/M15 · cTrader
Wskaźnik
The Break of Structure (BoSCHoCh) Indicator is a smart market structure tool designed to help traders easily spot trend.
Wskaźnik
EMA
VWAP
+2
ORB Range Indicator maps the opening range and gives a practical session-breakout workflow with clear labels.
Wskaźnik
BOS
CHOCH
+2
Free SMC on your chart: BOS / CHoCH / MSS structure and fair-value gaps. No repaint, and it measures itself.
Wskaźnik
Imbalance
Key Levels
+4
This indicator combines Multi-Timeframe Liquidity tracking, a dynamic Fair Value Gap (FVG) and a 50% Daily Range
Logo „SCOB”
Najwyżej oceniane
4.4
(5)
$19
/
$20
Wskaźnik
SMC
Prop
+12
SCOB - Single Candle Order Block Indicator
Wskaźnik
SMC
Prop
+13
Institutional FVG detection with HTF projection, precise volume deltas, and smart fill logic.
Wskaźnik
SMC
Prop
+15
Automatic Elliott Wave Detection with Professional Filters
Wskaźnik
Channel
Imbalance
+2
Adaptive volatility channel based on moving average and standard deviation (σ).

Cena

33.16K
Wolumen transakcji
25.96K
Zysk w pipsach
10
Sprzedaż
510
Bezpłatne instalacje