

FractalArrowBuySell
Wskaźnik
13 zakupy
Wersja 1.0, Jun 2025
Windows, Mac
4.3
Opinie: 3

Od 29/05/2025
3.05M
Wolumen transakcji
68.12K
Zysk w pipsach
29
Sprzedaż
885
Bezpłatne instalacje
Opis
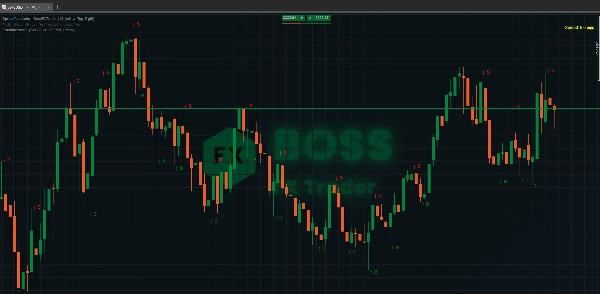
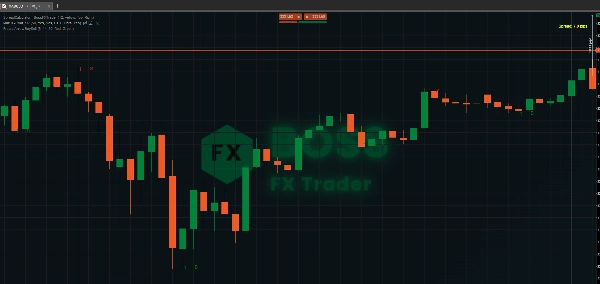
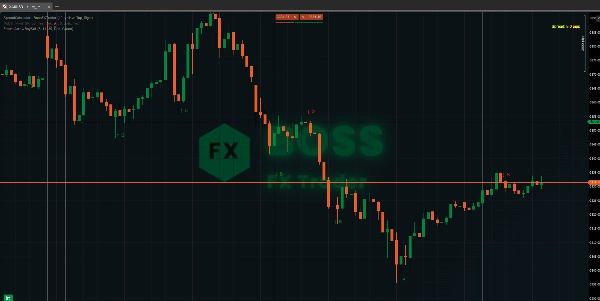
Wskaźnik Fractal Arrow Buy and Sell sygnalizuje właściwe podejście na rynku. Minimalizuj fałszywe sygnały przy wejściu i wyjściu.
Ostatnie 7 z 10 kopii zostanie sprzedanych po 20. Cena oryginalna wyniesie 39.
🖼️ Dlaczego korzystanie z tego jest tak ważne?:
Podsumowanie
AI summary
Fractal Arrow Buy and Sell Indicator provides visual signals for market entry and exit by displaying arrows and labels on price charts. It aims to reduce false signals through adjustable parameters including fractal period, arrow size, arrow offset label, and arrow color. The indicator marks buy signals with a green upward arrow below the candle accompanied by a green "B," and sell signals with a red downward arrow above the candle plus a red "S" slightly to the right.
The indicator supports multiple timeframes with recommended fractal settings and gain targets:
- 3-5 minutes timeframe: fractal set to 2, target gain 60-120 pips
- 15 minutes timeframe: fractal set to 5, target gain 300-500 pips
- 30 minutes timeframe: fractal set to 8, target gain 600-700 pips
Users can edit the instance name for easier identification. The indicator is designed to assist traders in identifying optimal buy and sell points by leveraging fractal analysis and customizable visual cues.
The indicator supports multiple timeframes with recommended fractal settings and gain targets:
- 3-5 minutes timeframe: fractal set to 2, target gain 60-120 pips
- 15 minutes timeframe: fractal set to 5, target gain 300-500 pips
- 30 minutes timeframe: fractal set to 8, target gain 600-700 pips
Users can edit the instance name for easier identification. The indicator is designed to assist traders in identifying optimal buy and sell points by leveraging fractal analysis and customizable visual cues.
Profil wskaźnika
Opinie klientów
4.3
Opinie: 3
5 | 33 % | |
4 | 67 % | |
3 | 0 % | |
2 | 0 % | |
1 | 0 % |
Opinie klientów
June 28, 2025
Useful when measured around swing point analysis. The useful part is reviewing reversals, pullbacks and swing zones, with the numbers checked before scaling. I would test 20 swing signals and ignore setups where the stop is wider than the 1.5R target. The level is useful when it supports the market story.
June 27, 2025
June 27, 2025
Cleaner way to review if the trader wants it helps identify turning points and cleaner structure. It works best as support, not a final decision maker. Swing points look better after 3 pivots, especially when the 0.5 Fib area agrees with structure. the signal still needs broader context.
Dyskusja
Częste pytania
Signal
Produkty dostępne za pośrednictwem cTrader Store, w tym boty handlowe, wskaźniki i wtyczki, dostarczane są przez deweloperów zewnętrznych i udostępniane wyłącznie w celach informacyjnych oraz w celu zapewnienia dostępu technicznego. cTrader Store nie jest brokerem i nie zapewnia doradztwa inwestycyjnego, nie udziela spersonalizowanych rekomendacji ani nie gwarantuje przyszłych wyników.



























Cena
Od 29/05/2025
3.05M
Wolumen transakcji
68.12K
Zysk w pipsach
29
Sprzedaż
885
Bezpłatne instalacje