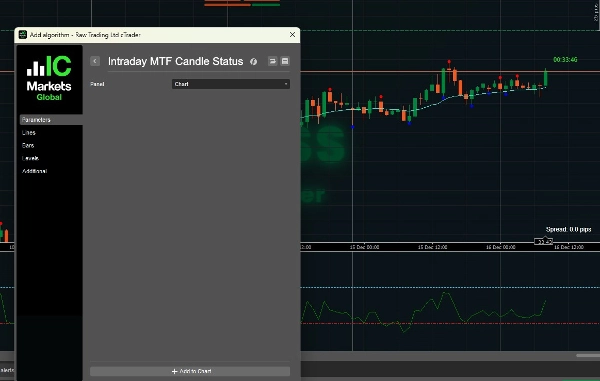
Brokers & props
For business
00
Days
:
00
Hours
:
00
Minutes
:
00
Seconds
Indicator
NAS100
NZDUSD
Martingale
Forex
Fibonacci
EURUSD
MACD
BTCUSD
SMC
Indices
ATR
Stocks
Grid
RSI
Breakout
XAUUSD
FVG
Commodities
Signal
Bollinger
GBPUSD
AI
VWAP
ZigZag
Prop
Supertrend
Crypto
USDJPY
Scalping
Intraday MTF Candle Status
16/12/2025
Desktop
Since 29/05/2025
Traded volume
1.46M
Pips won
26.39K
Sales
15
Free installs
433
"Intraday MTF Candle Status" uploaded image"Intraday MTF Candle Status" uploaded image"Intraday MTF Candle Status" uploaded image

1️⃣ What This Indicator Does?

This tool summarizes candle direction across multiple timeframes in one place on your chart.

For each timeframe, it checks the last closed candle and displays:

StatusMeaning

🟢 Bull

Close > Open (buyers in control)

🔴 Bear

Close < Open (sellers in control)

Doji

Close ≈ Open (indecision)

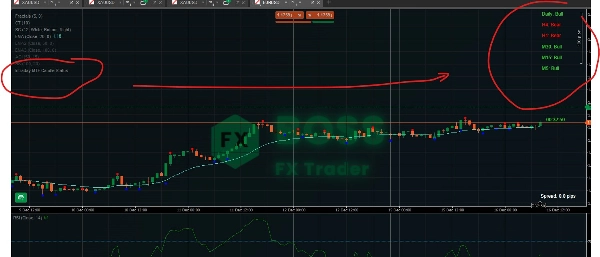
Displayed timeframes:

  • Daily
  • H4
  • H1
  • M30
  • M15
  • M5

All statuses are shown on the chart itself, so you don’t need to switch timeframes.


2️⃣ Why This Tool Is Powerful

🔥 Solves a Common Trader Problem

Most traders ask:

“Am I trading with or against the higher timeframe trend?”

This indicator answers that instantly.

Instead of guessing:

  • You see trend alignment
  • You avoid counter-trend entries
  • You improve timing & confidence

3️⃣ How the Indicator Works

📌 Candle Status Logic

  • Uses last closed candle (Last(1))
  • No repainting
  • Reliable confirmation

📌 Multi-Timeframe Data

  • Fetches real candle data from each timeframe
  • Independent of the chart timeframe you’re currently on

📌 On-Chart Display

  • Draws text labels on the top-right area
  • Color-coded for instant readability
  • Updated on every tick

4️⃣ How to Use It Effectively (Trading Scenarios)

🟢 Scenario 1: Trend Confirmation (Best Use Case)

✔ Rule:

Trade only when higher and lower timeframes agree

Example:

Daily: Bull
H4: Bull
H1: Bull
M15: Bull
M5: Bull

High-probability BUY environment

Use:

  • Pullbacks
  • Breakouts
  • Continuation entries

❌ Avoid SELLS here


🔴 Scenario 2: Counter-Trend Warning

Daily: Bull
H4: Bull
H1: Bear
M15: Bear
M5: Bear

⚠️ Market is in a pullback, not a reversal.

Best actions:

  • Wait for M5/M15 to turn Bull again
  • Avoid chasing SELLS
  • Look for buy setups at support


⚪ Scenario 3: Choppy / Ranging Market

Daily: Bull
H4: Doji
H1: Doji
M15: Bear
M5: Bull

🚫 Low-quality conditions

Recommended:

  • Reduce position size
  • Avoid breakout trades
  • Wait for structure clarity


5️⃣ Scalping Strategy Example (M5 Entries)

🔹 Ideal Buy Setup

  • Daily → Bull
  • H4 → Bull
  • H1 → Bull
  • M15 → Bull
  • M5 → Bear → turns Bull

📍 Entry:

  • When M5 flips back to Bull
  • Combine with:
    • Support
    • Fractals
    • EMA / VWAP


🔹 Ideal Sell Setup

Opposite logic:

  • Higher TFs → Bear
  • Enter on M5 pullback completion


6️⃣ Best Timeframe Combinations

Trading StyleFocus Timeframes

Scalping

H1 → M15 → M5

Intraday

H4 → H1 → M15

Swing

Daily → H4 → H1


7️⃣ What This Tool Is NOT

🚫 Not an entry signal by itself
🚫 Not a reversal indicator
🚫 Not a replacement for structure / price action

✅ It is a bias & confirmation tool


8️⃣ Best Indicators to Combine With

Highly recommended pairings:

  • ✅ Fractals (you already use this)
  • ✅ Market structure (HH / LL)
  • ✅ Support & Resistance
  • ✅ EMA 50 / EMA 200
  • ✅ VWAP


9️⃣ Pro Trading Rules Using This Tool

✔ Trade only in the direction of HTF
✔ Use LTF only for entry timing
✔ Ignore signals when Daily & H4 disagree
✔ Do not overtrade during mixed signals
✔ Let structure confirm the candle bias


🔟 Final Summary

IntradyMultiTimeframeCandleStatus = Market Bias Dashboard

It gives you:

  • Instant trend clarity
  • Higher probability trades
  • Less emotional decisions
  • Cleaner execution

Check out our product.

0.0
Reviews: 0
Customer reviews
No reviews for this product yet. Already tried it? Be the first to tell others!
More from this author
Market Sessions
Market Sessions is very important for traders.
Indicator
Signal
FractalArrowBuySell
Fractal Arrow Buy and Sell Indicator
MultiTF-Pivot_SR
MultiTF Pivot and SR Indicator
Indicator
NAS100
NZDUSD
Martingale
+22
Zigzag Trend
The ZigZag Trend is a market structure tool that filters out small price fluctuations and highlights major swing.
Area of Interest
Area of Interest with the power of AI to detect the market interest.
cBot
Grid
NAS100
NZDUSD
+17
Quick Trading Panel
Quick Trading Panel Cbot allows you to trade faster using a panel in a chart. This includes Trailing Trigger and Locked.
Break of Structure
The Break of Structure (BoSCHoCh) Indicator is a smart market structure tool designed to help traders easily spot trend.
Indicator
NAS100
NZDUSD
Martingale
+22
Candle Timer
Candle Timer best used for Scalper
Market BIAS Detector
The Market BIAS Detector is a smart trading assistant designed to identify the market.
Indicator
NAS100
NZDUSD
XAUUSD
+12
Volume Meter
Volume Meter
SpreadCalculator - BossFXTrader
Spread Calculator to calculate the difference between two prices or values.
You may also like
Indicator
Breakout
ATR
Scalping
Trend Volatility Trail
A volatility-adaptive trend-following indicator that dynamically adjusts to market conditions.
VegaXLR - cTrader Multi-Timeframe Pivot Pro
Customizable multi-timeframe pivot point indicator for cTrader with alerts, Fibonacci, CPR, and more!
Area of Interest
Area of Interest with the power of AI to detect the market interest.
Indicator
Bollinger
E7 Indicators Free Studies
ADXR, KDJ, SineWave, Bollinger Band Volatility and AEOscillator.
Indicator
Indices
Prop
Stocks
+3
LT_Ind_SRZones
Automatic Support/Resistance zones from swing points.
Candelstick xxl
The indicator is designed to detect aggressive movements in the market and without volume for trend changes.
Indicator
Stocks
Commodities
Forex
buy sell
SmartSignal Pro: Precise BUY/SELL signals to profit in any market. Trade like a pro! 🚀
Indicator
NAS100
NZDUSD
Indices
+8
ORB_BRSTrading
This indicator implements an Opening Range Breakout (ORB) trading strategy, designed to capture momentum during the most
Indicator
Indices
XAUUSD
Breakout
+5
cAlgoBuddy - ADX Divergences
This cTrader ADX Divergence indicator is used to quantify trend strength divergences in a very profitable way.
Indicator
Signal
USDJPY
On Balance Volume USD - Combined
See USD demand in one line—Composite OBV fuses six major FX pairs into a clear momentum gauge.
Indicator
NAS100
NZDUSD
Indices
+7
Hull Moving Average Colored
The traditional Hull Moving Average with different colours based on the slope (direction) of the trend.
Open Trade ProfitV1
A simple indicator that tracks the value of your open trades in pips.
Indicator
NAS100
NZDUSD
XAUUSD
+15
WVAP Neural Activity Scalp-Swing-Brake_noSourceCode
Pro trading dashboard: WVAP analysis + Volume Profile + Neural AI tracking + News alerts. All-in-one tool!
Supertrend TV
REAL Supertrend because default Ctrader Supertrend gives different signals
IR Spread
show spread on chart
Indicator
Grid
Breakout
XAUUSD
+10
Ultimate Trend ADX
Download Ultimate Trend ADX today and experience a smarter way to track market trends completely free on ctrader
MultiTF-Pivot_SR
MultiTF Pivot and SR Indicator
Previous Day Liquidity Zones (PDH - PDL)
Useful indicator for traders who want to visualize key price levels based on previous daily highs and lows.