
ADXMultiframeIndicator
Wskaźnik
1 zakupy
Wersja 1.0, Oct 2025
Windows, Mac
5.0
Opinie: 2
Opis
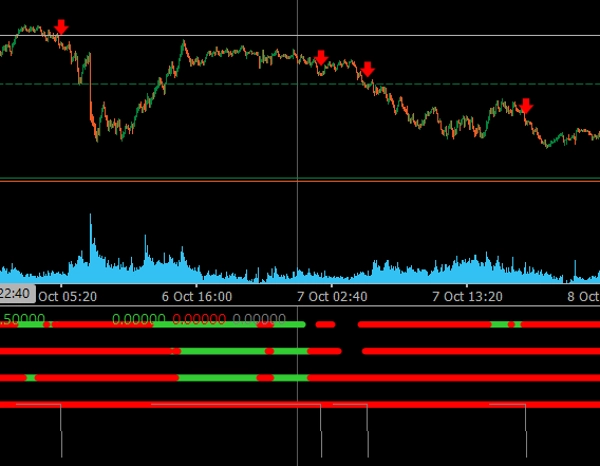
The Multi-Timeframe ADX Trend Dots & Arrows to profesjonalny wskaźnik handlowy dla cTrader, zaprojektowany do identyfikacji zgodnych trendów rynkowych na wielu ramach czasowych za pomocą Average Directional Movement Index (ADX).
🔹 Kluczowe cechy:
- ✅ Analiza do 4 konfigurowalnych ram czasowych (M15, H1, H4, Daily).
- ✅ Kolorowe kropki pokazują kierunkowe nastawienie (Zielony = Trend wzrostowy, Czerwony = Trend spadkowy).
- ✅ Automatyczne strzałki pojawiają się, gdy wszystkie ramy czasowe są zgodne w tym samym kierunku.
- ✅ Filtr kolejnych słupków redukuje fałszywe lub przedwczesne sygnały.
- ✅ Czysta, nowoczesna wizualizacja zoptymalizowana zarówno dla ciemnych, jak i jasnych motywów wykresów.
- ✅ Idealny do wykrywania potwierdzeń na wielu ramach czasowych oraz punktów kontynuacji trendu.
Ten wskaźnik jest idealny dla traderów, którzy chcą zobaczyć szerszy obraz i wchodzić na rynek tylko wtedy, gdy wszystkie ramy czasowe się zgadzają, zapewniając silniejsze i bardziej wiarygodne ustawienia handlowe.
Podsumowanie
Podsumowanie AI
The ADXMultiframeIndicator is a trading indicator for the cTrader platform that identifies market trends by analyzing the Average Directional Movement Index (ADX) across multiple timeframes. It supports up to four customizable timeframes, including M15, H1, H4, and Daily. The indicator displays colored dots to indicate directional bias—green for uptrends and red for downtrends—and automatically shows arrows when all selected timeframes align in the same direction. A consecutive bars filter is included to reduce false or premature signals. The visualization is designed to be clear and modern, compatible with both dark and light chart themes. This tool assists traders in confirming multi-timeframe trends and identifying trend continuation points by highlighting when all timeframes agree, facilitating more informed trade entries. It is particularly useful for analyzing indices markets.
Profil wskaźnika
Opinie klientów
5.0
Opinie: 2
5 | 100 % | |
4 | 0 % | |
3 | 0 % | |
2 | 0 % | |
1 | 0 % |
Opinie klientów
October 28, 2025
the first signal should not decide the only input, but it can look better than it is during a lucky run.
Dyskusja
Częste pytania
Indices
Produkty dostępne za pośrednictwem cTrader Store, w tym boty handlowe, wskaźniki i wtyczki, dostarczane są przez deweloperów zewnętrznych i udostępniane wyłącznie w celach informacyjnych oraz w celu zapewnienia dostępu technicznego. cTrader Store nie jest brokerem i nie zapewnia doradztwa inwestycyjnego, nie udziela spersonalizowanych rekomendacji ani nie gwarantuje przyszłych wyników.
Więcej od tego autora


Cena
Od 21/01/2025
3
Sprzedaż