RsiMultiFrameOBOS
อินดิเคเตอร์
เวอร์ชัน 1.0, Oct 2025
Windows, Mac
4.0
รีวิว: 1
Trading product for RsiMultiFrameOBOS อินดิเคเตอร์ BTCUSD Prop, image 2
ตั้งแต่ 21/01/2025
3
การขาย

คำอธิบาย

คำอธิบาย:
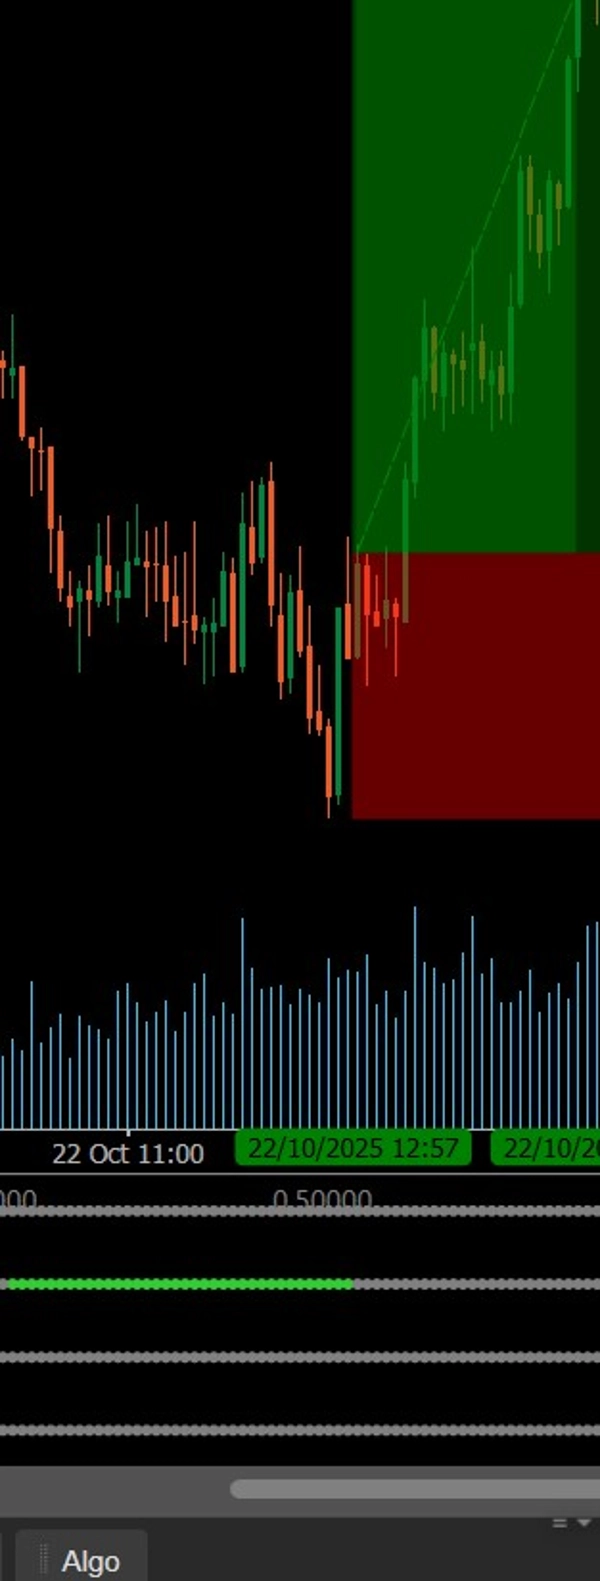
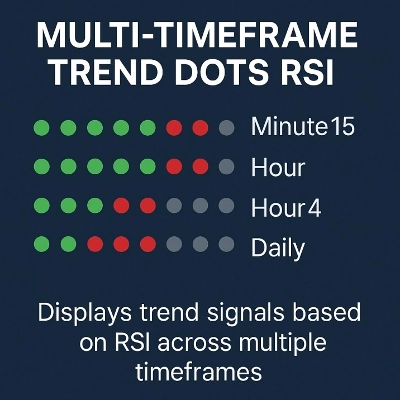
ตัวบ่งชี้นี้แสดงแนวโน้ม RSI ในสี่ช่วงเวลาที่ปรับแต่งได้โดยใช้จุดที่มีสีรหัส (สีเขียวสำหรับขายมากเกินไป สีแดงสำหรับซื้อมากเกินไป สีเทาสำหรับเป็นกลาง) ช่วยให้นักเทรดประเมินการจัดแนวโมเมนตัมตลาดได้ทันทีและระบุการยืนยัน RSI หลายช่วงเวลาสำหรับการเข้าซื้อที่แข็งแกร่งขึ้น

สรุป

สรุปโดย AI
RsiMultiFrameOBOS is an indicator that displays Relative Strength Index (RSI) trends across four customizable timeframes using color-coded dots: green for oversold, red for overbought, and gray for neutral conditions. This visualization enables traders to quickly assess momentum alignment and identify multi-timeframe RSI confirmations, supporting stronger trade entry decisions. The indicator is applicable across various markets including Forex, cryptocurrencies, stocks, commodities, and indices, and supports symbols such as BTCUSD, EURUSD, and XAUUSD. It is suitable for trading strategies like scalping and can assist in analyzing market momentum in multiple timeframes simultaneously.
โปรไฟล์อินดิเคเตอร์

รีวิวจากลูกค้า

4.0
รีวิว: 1
5
0 %
4
100 %
3
0 %
2
0 %
1
0 %
รีวิวจากลูกค้า
November 8, 2025
A few signals across sessions tell more, and the review screen feels calmer.

การสนทนา

คำถามที่พบบ่อย

BTCUSD
Prop
Forex
Scalping
Indices
EURUSD
Commodities
RSI
Crypto
Stocks
XAUUSD
Martingale
ผลิตภัณฑ์ที่มีให้บริการผ่าน cTrader Store รวมถึงบอทการเทรด อินดิเคเตอร์ และปลั๊กอิน มีให้บริการโดยนักพัฒนาบุคคลที่สามและมีไว้เพื่อวัตถุประสงค์ในการเข้าถึงข้อมูลและทางเทคนิคเท่านั้น cTrader Store ไม่ใช่โบรกเกอร์และไม่ได้ให้คำแนะนำการลงทุน คำแนะนำส่วนบุคคล หรือการรับประกันผลการดำเนินงานในอนาคต


เพิ่มเติมจากผู้เขียนคนนี้

อินดิเคเตอร์
A compact, visual multi-timeframe trend indicator for cTrader. Easily spot bullish or bearish trends across 4 customizab
อินดิเคเตอร์
Indices
Multi-Timeframe ADX Trend Dots & Arrows

นอกจากนี้คุณยังอาจชอบ

อินดิเคเตอร์
Key Levels
Liquidity Grab
+3
Visual market context dashboard showing bias states, CE positioning, session status and sweep context.
อินดิเคเตอร์
Zero Lag MACD delivers ultra-responsive trend and divergence signals with minimal lag, empowering timely Forex entries.
"Pattern Signal Forex" โลโก้
ยอดนิยม
5.0
(2)
$20
/
$40
อินดิเคเตอร์
RSI
Forex
+12
Indicator pattern signal moment
"SSL Channel" โลโก้
ยอดนิยม
5.0
(1)
$19
/
$20
อินดิเคเตอร์
Forex
BTCUSD
+10
Trend-following channel using dual MAs with visual cloud and optional alerts on crossovers
"Stochastic RSI PRO" โลโก้
เรตติ้งสูง
4.7
(4)
$28
/
$40
อินดิเคเตอร์
RSI
Prop
+14
Unlock Stochastic RSI PRO in cTrader! Overlay RSI, highlight zones, and identify divergences with customizable settings.
"FractalArrowBuySell" โลโก้
ยอดนิยม
4.3
(3)
$20
/
$39
อินดิเคเตอร์
Signal
Fractal Arrow Buy and Sell Indicator
อินดิเคเตอร์
BOS
Key Levels
+2
Maps bullish and bearish order block zones, CE levels and structure-based price action context.
อินดิเคเตอร์
Plots intraday VWAP and dynamic ±1/±2 standard deviation (SD) bands based on current day’s price and volume.
อินดิเคเตอร์
ATR
RSI
+3
🚀 Specialized algorithm is designed to confirm entry and exit points with precision 🎯
อินดิเคเตอร์
Block Liquidity,indicator.Block Order, Liquids Stops, Signal Sentiment,signal correctio.
อินดิเคเตอร์
RSI
EURUSD
+2
It identifies areas of market imbalance (Fair Value Gaps or FVGs) and projects them on the chart in a smart way
อินดิเคเตอร์
VWAP
Volume
+3
Don't trust static support and resistance levels, this indicator combines Fibonacci and VWAP in one powerful tool.
"Zero Lag LSMA" โลโก้
ยอดนิยม
4.6
(3)
$19
อินดิเคเตอร์
ZLSMA: Zero-lag trend indicator! Catch trends fast with customizable settings. Boost your trading precision.
"overbought oversold" โลโก้
ยอดนิยม
5.0
(2)
$19
/
$29
อินดิเคเตอร์
AI
ATR
+27
Overbought Oversold Indicator
"QX Heatmap Scanner" โลโก้
ยอดนิยม
4.3
(3)
$19
/
$38
อินดิเคเตอร์
ATR
RSI
+19
Multi-timeframe heatmap scoring Direction, Strength & Volatility at a glance!
อินดิเคเตอร์
AI-assisted
Order Block
+5
The daily bias estimator indicator uses ICT concepts to show whether the chart is bullish or bearish on multi-time frame
"PriceLevels" โลโก้
ยอดนิยม
5.0
(2)
$19
อินดิเคเตอร์
Displays the previous day's, last week's, and last month's highest and lowest price levels on your chart.
อินดิเคเตอร์
BOS
MSS
+3
Orderblocks with Multi-Timeframe.

ราคา

ตั้งแต่ 21/01/2025
3
การขาย