
Beschreibung
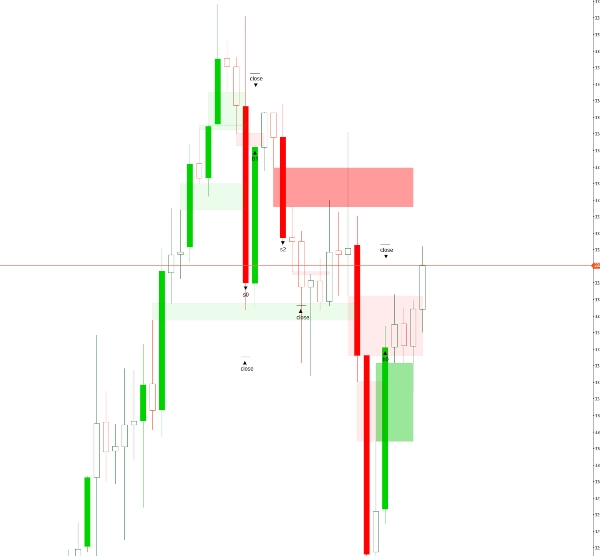
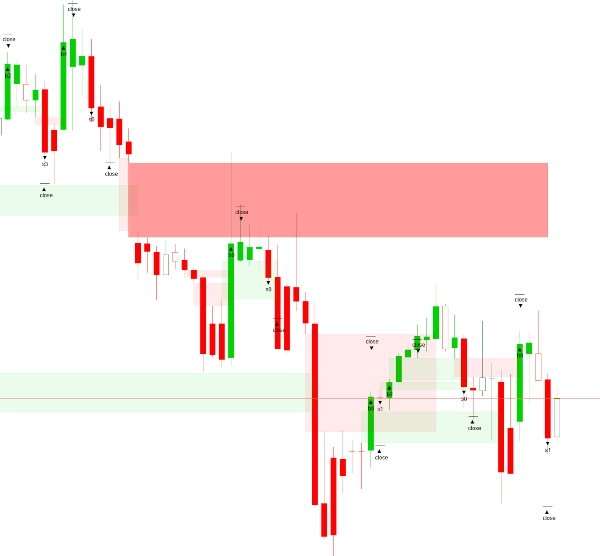
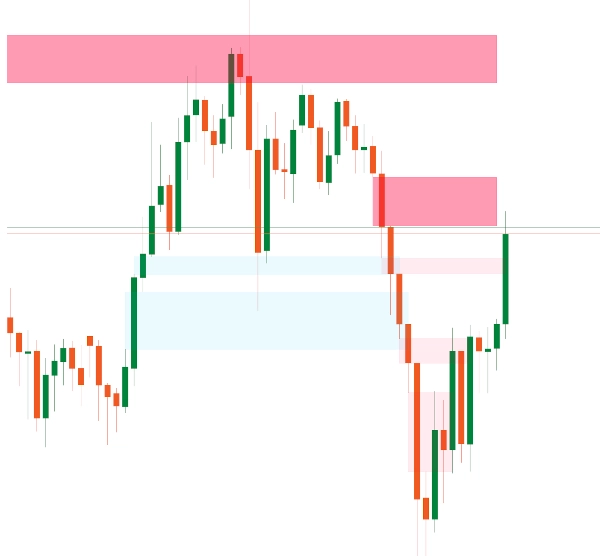
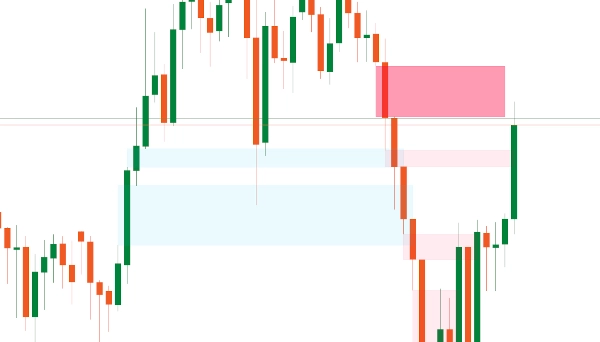
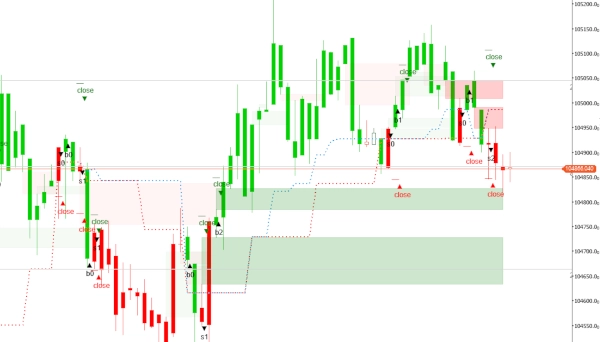
Dieser Fair Value Gap (FVG) Indikator ist ein Werkzeug der technischen Analyse, das entwickelt wurde, um Preisineffizienzen innerhalb der Finanzmärkte zu erkennen. Er identifiziert Bereiche, in denen der Preis schnell gestiegen oder gefallen ist und dabei eine „Lücke“ hinterlässt – eine Zone mit wenig bis keiner Handelsaktivität. Diese Lücken signalisieren oft ein vorübergehendes Ungleichgewicht von Angebot und Nachfrage, was darauf hindeutet, dass der Preis möglicherweise zurückkehrt, um die Lücke zu „füllen“, während der Markt nach Gleichgewicht strebt. Typischerweise wird ein FVG erkannt, wenn eine Preiskerze deutlich über dem Hoch oder unter dem Tief der vorherigen Kerze schließt, ohne sich zu überlappen, was auf einen potenziellen Reaktionsbereich hinweist. Dieses Verhalten wird oft mit institutionellem Handel oder algorithmischer Aktivität in Verbindung gebracht. Während die meisten Versionen dieses Indikators Ungleichgewichte auf einem einzelnen Zeitrahmen analysieren, fügt die Premium-Version Vielseitigkeit hinzu, indem sie Lücken aus höheren oder niedrigeren Zeitrahmen direkt im aktuellen Chart erkennt und anzeigt, was einen tieferen Kontext für die Analyse über mehrere Zeitrahmen bietet.
Einstellungen Übersicht
- Zu ladende Balken: Gibt die Anzahl der historischen Balken an, die analysiert werden sollen, beginnend mit dem zuletzt abgeschlossenen und rückwärts gehend.
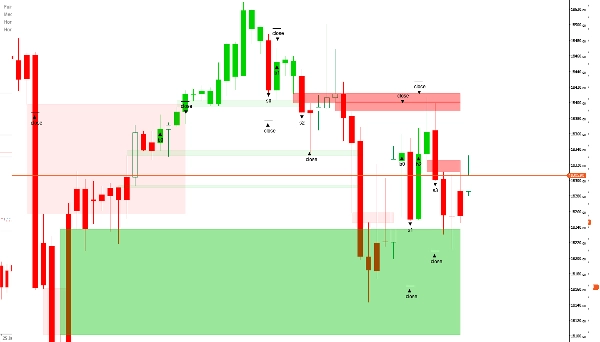
- Bullische FVG-Farbe: Legt die Farbe für FVGs fest, die in einem Aufwärtstrend erscheinen. Es wird eine 30%ige Transparenz angewendet, damit Elemente hinter der Lücke sichtbar bleiben.
- Bärische FVG-Farbe: Legt die Farbe für FVGs fest, die in einem Abwärtstrend erscheinen, ebenfalls mit 30% Transparenz für bessere Chart-Sichtbarkeit.
Premium-Funktionen (Verfügbar in der kostenpflichtigen Version)
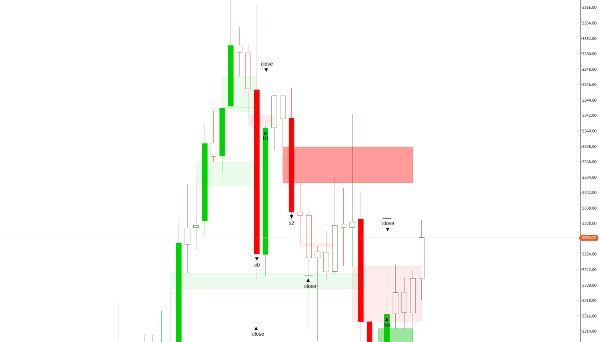
- Geschlossene Lücken löschen: Eine Boolesche Einstellung – wenn aktiviert („ja“), werden automatisch alle geschlossenen Lücken entfernt; wenn deaktiviert („nein“), bleiben die Lücken sichtbar. Dies ist besonders nützlich bei niedrigeren Zeitrahmen (unter 20 Minuten).
- Lücken bearbeiten/entfernen: Ermöglicht es Tradern, Lücken manuell anzupassen oder zu löschen. Dies gibt erfahrenen Tradern mehr Kontrolle, insbesondere da sehr kleine Lücken typischerweise wenig Einfluss auf die Preisbewegung haben.
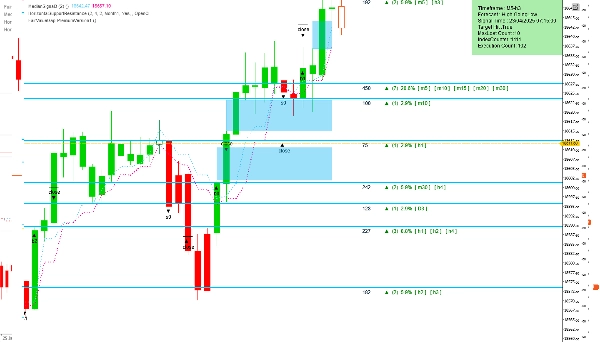
- Zeitrahmen einstellen: Bietet zwei Optionen – den aktuellen Chart-Zeitrahmen verwenden oder einen anderen für die Analyse auswählen, während die Ergebnisse weiterhin im Hauptchart angezeigt werden. Diese Funktion hilft Tradern, schneller Einblicke in wahrscheinliche Marktbewegungen zu gewinnen.
- Ausgewählter Zeitrahmen: Gibt den gewünschten Zeitrahmen für die Analyse an, wenn oben „Ausgewählter Zeitrahmen“ gewählt wurde.
- Genauigkeit kleiner Lücken: Ermöglicht es Tradern, eine bevorzugte Lückengröße als ganze Zahl einzugeben, um Lücken zu identifizieren, die historisch zu günstigen Ergebnissen führen. Der Wert basiert auf dem gesamten Datensatz und den beobachteten Lückengrößen für das Asset.
Standardmäßig scannt der Indikator alle Ungleichgewichte innerhalb eines einzelnen Zeitrahmens. Der Zugang zu Premium-Funktionen durch die FairValueGapPremium Version kann die analytischen Fähigkeiten jedoch erheblich verbessern.
Zusammenfassung
This indicator detects such gaps to highlight potential reaction zones. By default, it analyzes imbalances within a single timeframe. The premium version enhances functionality by allowing detection and display of FVGs from higher or lower timeframes directly on the current chart, supporting multi-timeframe analysis.
Key settings include the number of historical bars to analyze and customizable colors for bullish and bearish gaps with transparency for chart clarity. Premium features offer options to automatically delete closed gaps, manually edit or remove gaps, select analysis timeframes independent of the chart’s timeframe, and specify gap size accuracy to focus on significant gaps.
This tool aids traders in identifying price inefficiencies and probable market reaction areas through detailed gap analysis across multiple timeframes.
Kundenbewertungen
5 | 100 % | |
4 | 0 % | |
3 | 0 % | |
2 | 0 % | |
1 | 0 % |


