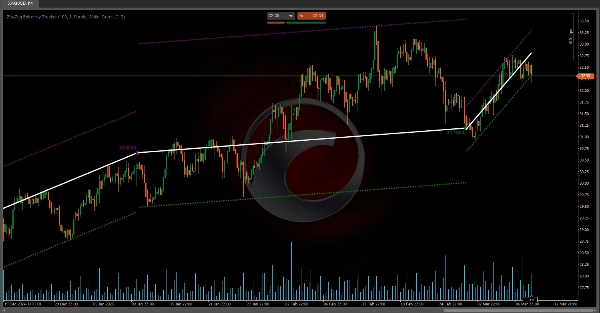
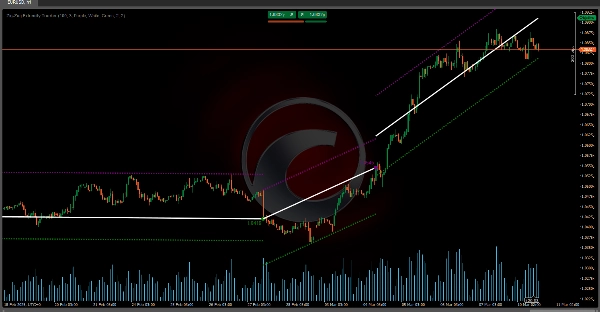
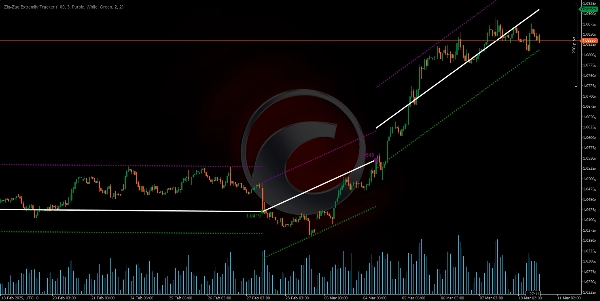
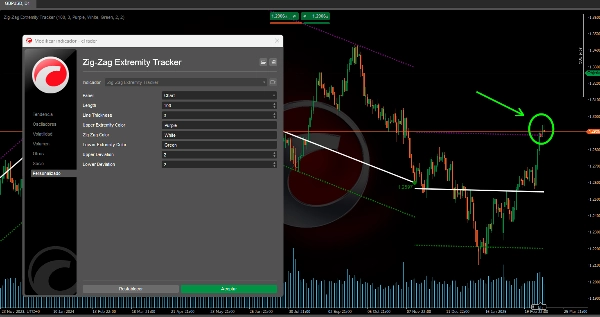
Indikator
RSI
Breakout
Supertrend
Zig-Zag Extremity Tracker
„Zig-Zag Extremity Tracker“-Logo
03/09/2025
2
Desktop
In „Zig-Zag Extremity Tracker“ hochgeladenes BildIn „Zig-Zag Extremity Tracker“ hochgeladenes BildIn „Zig-Zag Extremity Tracker“ hochgeladenes BildIn „Zig-Zag Extremity Tracker“ hochgeladenes Bild

💡 Linear Regression Channels and ZigZag Points 💡

The linear regression channels are recalculated and reset each time the price moves beyond the expected boundaries (bands), ensuring the measurement remains up-to-date with the market’s real trend.

The marked points (circles) represent extremes (highs and lows) that serve as the basis for drawing the ZigZag and determining where the channels are calculated from.

This dynamic approach allows for better visualization of potential trend changes, as well as areas of overextension or overselling where the price might revert toward the mean.

How do the channels relate to the ZigZag and the extreme points?

• Whenever a new extreme (high or low) is detected, the indicator not only plots a circle and the ZigZag line connecting that point to the previous one, but also readjusts the potential linear regression channel being drawn from that last extreme.

• If, during the following bars, the price remains within the bands, the channel stays active and extends to the current bar.

• If at any point the price breaks those bands, the indicator “assumes” the channel has been invalidated and starts a new one from the bar where the break occurred.

Ctrader Store indicators:


Channel Breakout System

Fair Value Gap Sessions

 BOS & CHOCH

ZigZag

Supertrend

Market Imbalance

Adaptive Trend Channel 

Dynamic Market Structure
Analysis of Turning Points

Order Block

Fibonacci Linear
Regression Multi-timeframe

Volume POC Heatmap

Dynamic RSI

Momentum Fair Value Gap

Market Flow Projection

Dynamic Trend Gradient

Multi-Level Candle Bias
Tracker

Zig-Zag Extremity Tracker

Reactive Moving Average

Auto-Trend Channel

Auto Support and
Resistance Trend Lines

All Support and
Resistance Levels

Leverage Liquidation Map

Zones Supply Demand

Dynamic Range Momentum

Dynamic Market Structure Analysis of Turning Points

Order Block

Fibonacci Linear Regression Multi-timeframe

Volume POC Heatmap

ZigZag

Dynamic RSI

Market Flow Projection

Dynamic Trend Gradient

Multi-Level Candle Bias Tracker

Reactive Moving Average

Auto-Trend Channel

Auto Support and Resistance Trend Lines

All Support and Resistance Levels

Leverage Liquidation Map

Zones Supply Demand

Dynamic Range Momentum

Supertrend

0.0
Bewertungen: 0
Kundenbewertungen
Bisher gibt es keine Bewertungen für dieses Produkt. Haben Sie es schon ausprobiert? Dann können Sie die erste Person sein, die andere darüber informiert!
Mehr von diesem Autor
Indikator
RSI
Breakout
XAUUSD
+6
ZigZag
ZigZag filters noise, spots trends, patterns, pivots, aiding analysis, trade management, and confirmations. 📉📈
Indikator
RSI
Breakout
XAUUSD
+6
Order Block
Identify bullish and bearish Order Blocks to spot key support/resistance levels and potential trend reversals! 📈🔄
Indikator
RSI
Breakout
XAUUSD
+5
Auto-Trend Channel
Adaptive trend channel using linear regression and Pearson correlation for dynamic support, resistance, and trends.
Indikator
RSI
XAUUSD
Breakout
+5
BOS & CHOCH
Market structural patterns , specifically the concepts of Change of Character (ChoCH) 🔄 and Break of Structure (BoS) 💥
Indikator
RSI
Breakout
XAUUSD
+5
Zones Supply Demand
📊Zones Supply & Demand: Identifies key price levels with high volume concentration, marking Supply/Demand Zones & Marke
Indikator
RSI
Breakout
Supertrend
All Support and Resistance Levels
"Identify key market zones and visualize support/resistance from multiple timeframes on a single chart.
Indikator
RSI
Breakout
XAUUSD
+6
Volume POC Heatmap
📊 Shows volume by price levels, highlights POC, and key zones. Identifies dynamic support/resistance and imbalances.
Indikator
RSI
Breakout
XAUUSD
+5
Supertrend
💹 Define a price channel 📈 and determine trend direction (bullish 🟢 or bearish 🔴).
Indikator
RSI
Breakout
XAUUSD
+6
Fair Value Gap Sessions
identify and highlight temporary market inefficiencies known as "fair value gaps" 🚨 within specific trading Sessions.
Indikator
RSI
Breakout
XAUUSD
+4
Dynamic Market Structure Analysis of Turning Points
Identify market structure effortlessly with swing highs, lows, CHoCH, and BOS levels for smart trading decisions! 📊🔍"
Indikator
Indices
RSI
XAUUSD
+7
RSI Divergence
Detects bullish and bearish divergences
Indikator
RSI
Breakout
Supertrend
Trend Heikin Multi MA
🚀 TrendHeikinMultiMA: Advanced trend detection using Heikin-Ashi smoothing & MAs! Eliminates noise, confirms real trend
Indikator
RSI
Breakout
XAUUSD
+4
Multi-Level Candle Bias Tracker
Price direction by calculating the probability of reaching new highs/lows. Shows levels & stats📈
Indikator
RSI
Breakout
Supertrend
Leverage Liquidation Map
📊 Liquidation Map: Potential areas where highly leveraged investors might face liquidations.
Indikator
RSI
Breakout
Supertrend
Market Trend OB
Price action to detect when the market changes trend (MSB) and defines, order blocks , ZigZag etc.📊
Advanced Market Structure Bos,Choch,SwinLevels, Order Blog
Advanced price action tool that combines multiple technical analysis concepts
Indikator
RSI
Breakout
Supertrend
Swing Levels
🔍 Automatically detect support and resistance levels based on "swings" or pivots
Indikator
RSI
Breakout
Supertrend
+1
Momentum Fair Value Gap
It identifies areas of market imbalance (Fair Value Gaps or FVGs) and projects them on the chart in a smart way
Das könnte Sie auch noch interessieren
Indikator
Signal
Scalping
[Stellar Strategies] Linear Regression Candles 1.1
Approach to price analysis by visualizing candlestick data through the lens of linear regression slopes 📈📉
Indikator
Indices
Forex
EURUSD
+1
DXY w HMA
DXY HMA Indicator
ICT Killzone and Sessions high_low
This indicator is an essential tool for traders seeking to visualize key trading sessions on their charts.
Indikator
NAS100
Indices
XAUUSD
+7
InstitutionalSignalOscillator
A precision-engineered indicator designed for traders who demand signal integrity across volatile markets.
Indikator
RSI
Breakout
Supertrend
TrendMaster Pro MultiMA
Connects each moving average value from candle to candle, forming a fan-like structure of trendlines.
Indikator
RSI
Breakout
XAUUSD
+4
Multi-Level Candle Bias Tracker
Price direction by calculating the probability of reaching new highs/lows. Shows levels & stats📈
Indikator
Indices
RSI
ATR
AlgoCorner Crosshair Edge
Pinpoint, highlight and lock market data easily
TDI_Pro
Traders Dynamic Index (TDI) — Divergence Edition
Indikator
Grid
Breakout
XAUUSD
+10
Ultimate Trend ADX
Download Ultimate Trend ADX today and experience a smarter way to track market trends completely free on ctrader
Indikator
NAS100
NZDUSD
Breakout
+14
Adaptive Trailing System
🚀 Adaptive trailing stop that uses logarithmic normalized volatility....
Indikator
NAS100
NZDUSD
Breakout
+11
Previous day Key Levels
Previous day key levels indicator
Indikator
Breakout
Scalping
SSL Channel
SSL Channel — Trusted by price action traders to stay on the right side of the trend.
Indikator
NAS100
NZDUSD
Martingale
+25
Volume Profile Suite trial7D
DEMO VERSION 7 DAYS VolumeProfileSuite is an advanced and flexible Volume Profile indicator for cTrader.
[Hamster-Coder] Pivot Points MTF
[Hamster-Coder] Pivot Points (Multi Time Frame)
Indikator
RSI
Breakout
XAUUSD
+9
Square Matrix Trading System
Square Matrix Trading System by LudwigICT – Institutional-Grade Trading Clarity in cTrader
Tradingview Economic Calendar onn Chart
Customizable window inside your platform, access to any website Calendar
Indikator
Indices
Prop
Stocks
+3
LT_Ind_SRZones
Automatic Support/Resistance zones from swing points.
Indikator
Indices
RSI
Signal
+2
[Stellar Strategies] Ultimate Trend & Momentum Dashboard
A comprehensive cTrader indicator designed to give you a quick, at-a-glance understanding of market sentiment 📈📉