
Opis
🏆 Ponad 10 000 traderów ufa naszemu zestawowi 25+ algorytmów! 🏆
Od Struktury Rynku i Płynności do Inteligentnych Systemów Wyjścia i Narzędzi Predykcyjnych - stworzyliśmy KAŻDE narzędzie, którego potrzebujesz do konsekwentnej pracy.
👉 Uzyskaj dostęp do wszystkich 25+ SPRAWDZONYCH systemów:
_______________________________________________
📌 Wskaźniki Struktury Rynku
· ✅ AdvancedMarket Structure: Bos, Choch, SwinLevels, Order Blocks, Market Structure& Liquidity Finder
· 🔄 Dynamiczna analiza struktury rynku punktów zwrotnych
· 🧱 Order Block
· ⚖️ Nierównowaga Rynku
· ⛓️ BOS & CHOCH
· 🧠 ICT Power of 3
_______________________________________________
🔚 Inteligentne Systemy Wyjścia
_______________________________________________
📐 Wskaźniki ZigZag
· 🔍 Projekcja Płynności Ceny ZigZag
· ➖ ZigZag
_______________________________________________
🧱 Wskaźniki Wsparcia i Oporu
· 🟩 SmartTrend Linie Wsparcia i Oporu
· 🧱 Wszystkie Poziomy Wsparcia i Oporu
_______________________________________________
📊 Wskaźniki Trendu i Kanału
· 📊 Supertrend
· 🌈 Dynamiczny Gradient Trendu
_______________________________________________
💧 Narzędzia Wolumenu i Płynności
_______________________________________________
⚡ Wskaźniki Momentum i RSI
· 🔎 Multi-Level Candle Bias
Tracker
_______________________________________________
🔮 Narzędzia Predykcji i Projekcji
· 📐 Predykcja oparta na Linreg & ATR
· 📏 Fibonacci Linear Regression Wieloczasowa
· 📈 Projektor Przepływu Rynku Napędzanego Wolumenem_________________________
_________________________________________________________________________________________________
_________________________________________________________________________________________________
ZigZag Structure Pro – 🚀
Automatycznie identyfikuje istotne punkty zwrotne rynku (kluczowe maksima i minima) oraz rysuje dynamiczne strefy wsparcia i oporu aktualizujące się w czasie rzeczywistym. 🎯 W przeciwieństwie do tradycyjnych statycznych poziomów, ten wskaźnik nieustannie dostosowuje się do zmieniającej się struktury cenowej.
Do czego służy? ❓
Ten wskaźnik to profesjonalne narzędzie analizy technicznej zaprojektowane do:
- Identyfikacji poziomów instytucjonalnych: 🏛️ Automatycznie wykrywa punkty, w których cena utworzyła ważne struktury wysokich i niskich poziomów.
- Analizy struktury rynku: 📊 Klasyfikuje każdy ruch zgodnie z metodologią struktury byczej/niedźwiedziej (Higher Highs, Lower Lows itp.).
- Projekcji trendu: 🔮 Przedłuża linie trendu w przyszłość, aby przewidzieć potencjalne strefy reakcji cenowej.
- Handlu odwróceniami i kontynuacjami: 💰 Oznaczone poziomy służą jako odniesienie dla wejść, stop-lossów i celów zysku.
Wskaźnik rysuje na Twoim wykresie: ✍️
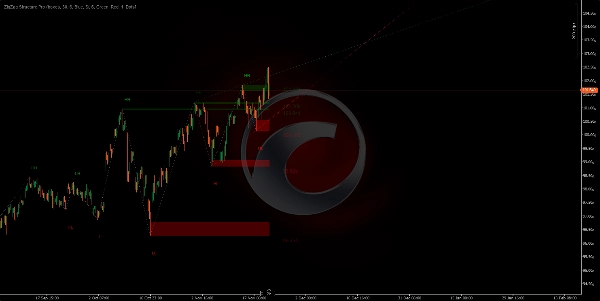
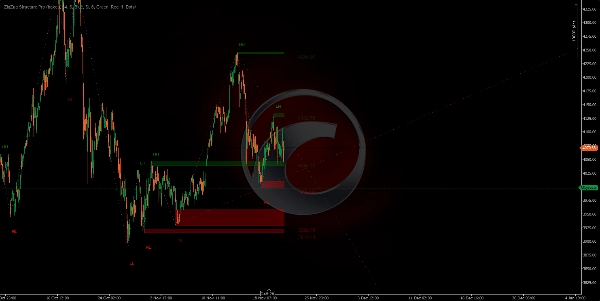
1. Strefy wsparcia/oporu (prostokąty)
- Zielone strefy: 🟢 Oznaczają obszary wsparcia (istotne minima, gdzie cena może odbić).
- Czerwone strefy: 🔴 Oznaczają obszary oporu (istotne maksima, gdzie cena może się cofnąć).
- Te strefy są projekcją w przód, pokazując aktualne aktywne poziomy.
- Grubość każdej strefy reprezentuje korpus świecy, na której utworzono pivot.
https://chartshots.spotware.com/c/691f5a4d75ac4
https://chartshots.spotware.com/c/691f6b4f2e98b
https://chartshots.spotware.com/c/691f6c6fda808
https://chartshots.spotware.com/c/691f6d0aa6155
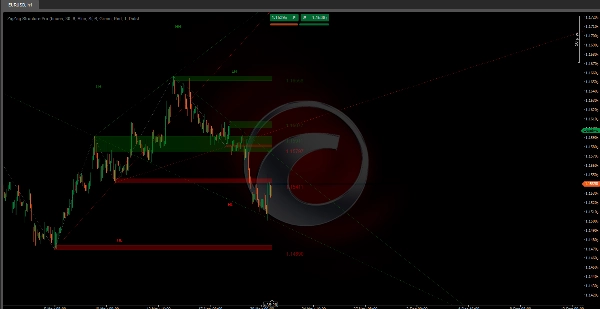
2. Linie łączące ⚡
- Łączą każdy pivot z następnym, tworząc wizualny wzór "zigzag".
- Eliminują szumy rynkowe, pokazując tylko naprawdę istotne ruchy.
- Ułatwiają szybkie zobaczenie kierunku i struktury trendu na pierwszy rzut oka.
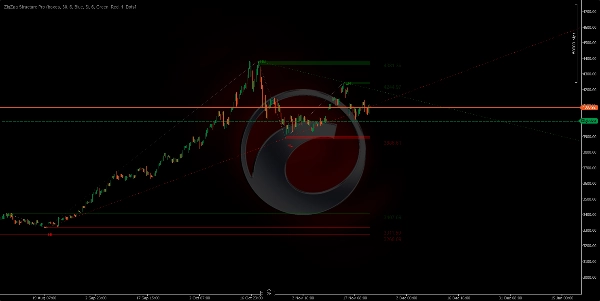
3. Projekcje linii trendu (wydłużone zielone/czerwone)
- Rysowane od poprzedniego pivot do aktualnego i wydłużone w przyszłość.
- Zielone: 🟢 Linie trendu wzrostowego (od minimów).
- Czerwone: 🔴 Linie trendu spadkowego (od maksimów).
- Pokazuje 2 najnowsze i aktywne linie trendu.
- Przydatne do wykrywania wybić lub respektów trendu.
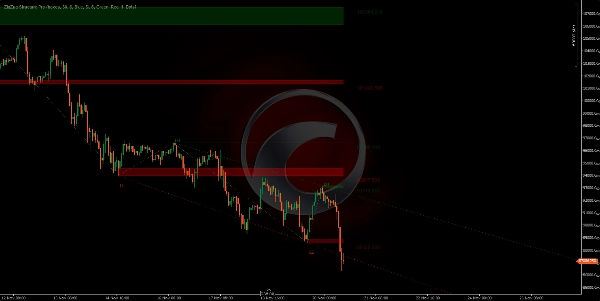
4. Etykiety struktury rynku 🏷️
Każdy pivot pokazuje etykietę wskazującą jego klasyfikację:
- HH (Higher High): ↗️ Wyższe maksimum - kontynuacja wzrostowa.
- LH (Lower High): ⬆️ Niższe maksimum - możliwe odwrócenie spadkowe.
- HL (Higher Low): ⬇️ Wyższe minimum - możliwe odwrócenie wzrostowe.
- LL (Lower Low): ↘️ Niższe minimum - kontynuacja spadkowa.
Logika algorytmu 🧠
Wskaźnik wykorzystuje adaptacyjny algorytm zigzag, który:
- Skanuje cenę w poszukiwaniu maksimów i minimów w konfigurowalnym okresie (domyślnie 34 świece).
- Filtruje nieistotne ruchy przez minimalny próg odchylenia (domyślnie 6 pipsów).
- Weryfikuje każdy pivot zapewniając, że reprezentuje rzeczywistą zmianę struktury rynku.
- Porównuje struktury między kolejnymi pivotami, aby sklasyfikować typ ruchu.
- Dynamicznie aktualizuje strefy w miarę pojawiania się nowych pivotów, usuwając najstarsze.
Główne ustawienia ⚙️
- Liczba świec do analizy pivotów: Kontroluje czułość detektora pivotów (mniejsza = więcej pivotów, większa = tylko główne pivoty).
- Filtr odchylenia ceny: Filtr szumów - ruchy mniejsze niż ta wartość są ignorowane.
- Maksymalna liczba widocznych stref: Liczba historycznych poziomów pozostających widocznymi (od 1 do 20).
- Typ wyświetlania stref: Wybierz między prostokątami (pełne strefy) lub prostymi liniami.
- Pokaż wydłużone linie trendu: Aktywuj/dezaktywuj projekcje trendu.
Szybki przewodnik po parametrach 📖
Liczba świec do analizy pivotów (Domyślnie: 30)
- ↑ Zwiększ (40-100): MNIEJ pivotów, ważniejszych. Do swing tradingu.
- ↓ Zmniejsz (15-25): WIĘCEJ pivotów, więcej sygnałów. Do scalping/day tradingu.
Filtr odchylenia ceny (Domyślnie: 6)
- ↑ Zwiększ (8-15): Filtruje szumy, tylko duże ruchy. Mniej sygnałów, wyższa jakość.
- ↓ Zmniejsz (2-5): Bardziej czuły, wychwytuje małe ruchy. Więcej sygnałów.
Maksymalna liczba widocznych stref (Domyślnie: 6)
- ↑ Zwiększ (10-20): Więcej widocznych historycznych poziomów. Do głębokiej analizy.
- ↓ Zmniejsz (2-4): Tylko ostatnie poziomy. Czysty wykres.
Limit historycznych pivotów (Domyślnie: 200)
- ↑ Zwiększ (300-500): Więcej historii do obliczeń. Analiza długoterminowa.
- ↓ Zmniejsz (50-150): Tylko ostatnia struktura. Lepsza wydajność.
Liczba aktywnych projekcji (Domyślnie: 5)
- ↑ Zwiększ (5-10): Więcej projektowanych linii trendu.
- ↓ Zmniejsz (1-2): Tylko dominujące trendy. Większa przejrzystość.
Pokaż wydłużone linie trendu (Tak/Nie)
- Włączone: Projekcje trendów w przyszłość.
- Wyłączone: Tylko historyczny zigzag.
🎯 Szybkie ustawienia
- Scalping: Lookback 15-20 | Odchylenie 3-5 | Strefy 3-4
- Day Trading: Lookback 25-35 | Odchylenie 6-8 | Strefy 5-6
- Swing Trading: Lookback 40-60 | Odchylenie 10-15 | Strefy 8-12
Podsumowanie
Key features include:
- Support and resistance zones displayed as rectangles, with green zones marking support (significant lows) and red zones marking resistance (significant highs). These zones are projected forward to show current active levels.
- Connection lines linking pivots to form a clear zigzag pattern, illustrating trend direction and structure.
- Projected trend lines extended into the future, color-coded green for bullish trends and red for bearish trends, highlighting recent active trends and potential breakout or respect points.
- Configurable settings such as pivot lookback period, price deviation filter to reduce noise, maximum visible zones, and option to enable or disable extended trendline projections.
This indicator supports analysis across various markets including Forex, stocks, commodities, indices, and cryptocurrencies. It is suitable for different trading styles, from scalping and day trading to swing trading, by adjusting sensitivity parameters accordingly.
Opinie klientów
5 | 0 % | |
4 | 100 % | |
3 | 0 % | |
2 | 0 % | |
1 | 0 % |


![Logo „Gaussian Channel [Iridio Capital]”](https://cdn.ctrader.com/image/webp/7c039209-5573-4a54-a072-f9528b503103_41960)


