
Opis
VolumeProfileSuite to zaawansowany i elastyczny wskaźnik profilu wolumenu dla cTrader.
Jego głównym celem jest analiza rozkładu wolumenu (tj. gdzie miała miejsce aktywność handlowa) na różnych poziomach cenowych, aby zidentyfikować obszary "wartości" (wysoki wolumen) i "odrzucenia" (niski wolumen). Pomaga to znaleźć najważniejsze poziomy wsparcia i oporu oparte na rzeczywistej aktywności rynku.
Jego unikalną cechą jest łączenie dwóch potężnych trybów analizy w jedno narzędzie, wybieralne za pomocą parametru Profile Mode:
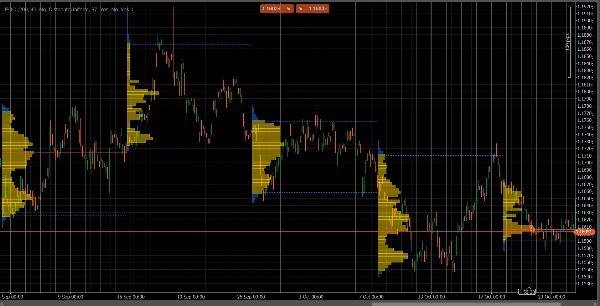
FixedRangeMode: Idealny do analizy makro. Pozwala analizować pojedynczy, duży blok wybrany przez użytkownika (np. ostatnie 1000 świec lub określony zakres dat, np. "cały ostatni tydzień"). Jest idealny do znajdowania głównych, długoterminowych poziomów wsparcia/oporu.PeriodicMode: Idealny do analizy mikro i behawioralnej. Automatycznie rysuje nowy profil co "N" świec (np. co 100 świec). Pozwala to zobaczyć, jak POC i obszar wartości zmieniają się w czasie oraz badać powtarzalne wzorce rynku.- Przewodnik po parametrach (angielski)
Oto zaktualizowany przewodnik dla Twojego nowego zunifikowanego VolumeProfileSuite wskaźnika. Ten przewodnik jest kluczowy, ponieważ wyjaśnia, które parametry należy stosować (a które ignorować) w zależności od wybranego trybu.
Grupa 1: Główny tryb
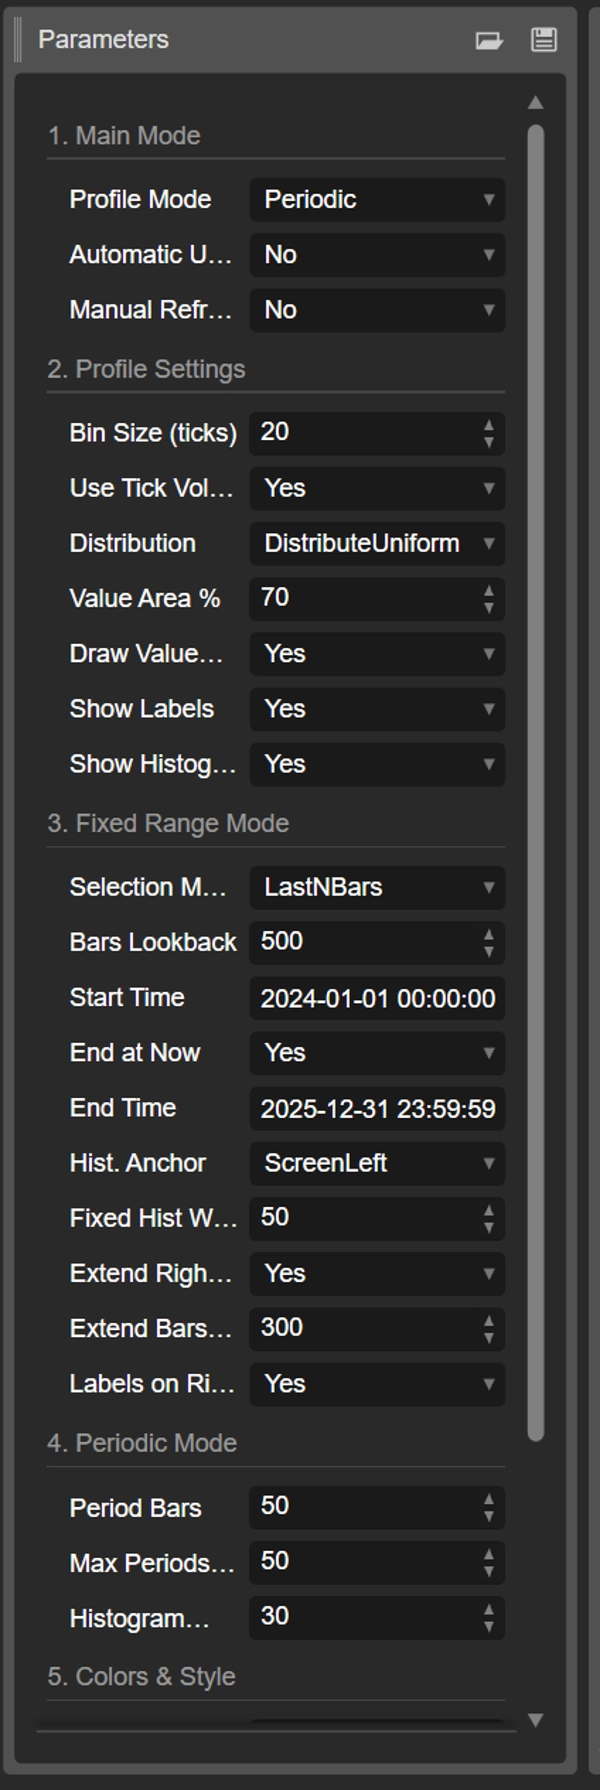
- Profile Mode: To jest najważniejszy parametr i działa jako główny przełącznik.
-
FixedRange: Aktywuje tryb "pojedynczego bloku". Wskaźnik będzie analizował tylko jeden interwał określony przez Ciebie (za pomocą ustawień w Grupie 3).Periodic: Aktywuje tryb "cykliczny". Wskaźnik będzie automatycznie analizował cały wykres w blokach (na podstawie ustawień w Grupie 4).
WAŻNE: W trybie
FixedRangemusisz ignorować wszystkie parametry z "Grupy 4: Tryb okresowy". W trybiePeriodicmusisz ignorować wszystkie parametry z "Grupy 3: Tryb Fixed Range".
Grupa 2: Ustawienia profilu
Te parametry są wspólne i dotyczą obu trybów (FixedRange i Periodic).
- Rozmiar binu (ticki): Kontroluje pionową "rozdzielczość" profilu. Niska wartość (np.
1) tworzy wiele cienkich rzędów cenowych (bardzo szczegółowe). Wysoka wartość (np.10) grupuje ceny w grubsze rzędy (mniej szczegółowe, "gładsze"). - Używaj wolumenu ticków: Jeśli
true(zalecane), profil używa rzeczywistego wolumenu ticków, co jest bardzo dokładne. Jeślifalse, po prostu liczy "1" dla każdej świecy. - Dystrybucja: Określa, jak wolumen świecy jest rozkładany.
-
DistributeUniform(domyślnie): "Rozkłada" wolumen świecy na wszystkie poziomy cenowe, które dotknęła, od jej minimum do maksimum.CloseOnly: Przypisuje cały wolumen świecy tylko do ceny zamknięcia.
- Procent obszaru wartości: Ustawia procent wolumenu, który stanowi "Obszar Wartości" (obszar najwyższej aktywności handlowej). Wartość
70(70%) to standard rynkowy. - Rysuj obszar wartości (VAH/VAL): Jeśli
true, rysuje poziome linie dla Value Area High (VAH) i Value Area Low (VAL). - Pokaż etykiety: Jeśli
true, pokazuje etykiety tekstowe ("POC", "VAH", "VAL"). (Uwaga: w trybiePeriodicmoże to zaśmiecać wykres). - Pokaż histogram: Jeśli
true, rysuje histogram wolumenu (poziome paski).
Grupa 3: Tryb Fixed Range
⚠️ Używaj tych parametrów TYLKO jeśli "Profile Mode" jest ustawiony na FixedRange.
- Tryb wyboru: Wybiera jak zdefiniować pojedynczy blok.
-
DateRange: Używa określonej daty/godziny rozpoczęcia i zakończenia.LastNBars: Używa ostatnich N świec.
- Liczba świec wstecz: (tylko dla
LastNBars) Ile świec wstecz analizować (np.500). - Czas rozpoczęcia / Zakończ teraz / Czas zakończenia: (tylko dla
DateRange) Definiuje początek i koniec interwału. - Kotwica histogramu: (tylko dla
FixedRange) Określa, gdzie zakotwiczyć histogram. -
DateRangeStart: Na początku Twojego interwału (może być poza ekranem).ScreenLeft: Do lewej krawędzi widocznego okna.ScreenRight: Do prawej krawędzi widocznego okna (w pustym miejscu).
- Stała szerokość histogramu (świece): Szerokość histogramu (w świecach) dla trybu
FixedRange. - Rozszerzaj tylko w prawo: Jeśli
true, linie POC/VAH/VAL są rozszerzane w przyszłość. - Rozszerz liczbę świec: (Tylko jeśli
Extend Right Onlyjesttrue) O ile świec rozszerzyć linie. - Etykiety po prawej: Jeśli
true, umieszcza etykiety cenowe na prawym końcu rozszerzonych linii.
Grupa 4: Tryb okresowy
⚠️ Używaj tych parametrów TYLKO jeśli "Profile Mode" jest ustawiony na Periodic.
- Liczba świec w okresie: To jest kluczowy parametr dla tego trybu. Określa, ile świec ma być zawartych w każdym cyklicznym bloku (np.
100). - Maksymalna liczba okresów do narysowania: 🌟 PARAMETR BEZPIECZEŃSTWA! Ogranicza liczbę rysowanych profili cyklicznych, aby zapobiec awarii cTrader. Wartość
50oznacza, że zostanie narysowanych tylko ostatnich 50 profili, nawet jeśli historia jest dłuższa. Nie ustawiaj tego zbyt wysoko (np. > 200), bo cTrader może się zawiesić! - Szerokość histogramu (świece): Szerokość histogramu (w świecach) dla każdego cyklicznego bloku.
Grupa 5: Kolory i styl
Te parametry są wspólne i dotyczą obu trybów.
- Kolor POC: Kolor linii Point of Control.
- Kolor VA: Kolor linii VAH i VAL.
- Grubość linii: Grubość linii POC, VAH i VAL.
- Kolor histogramu VA: Kolor słupków histogramu wewnątrz obszaru wartości (domyślnie: żółty).
- Kolor histogramu na zewnątrz: Kolor słupków histogramu poza obszarem wartości (domyślnie: niebieski).
- Przezroczystość histogramu %: Przezroczystość (opakowanie) całego histogramu.
Podsumowanie
The indicator offers two main analysis modes selectable via the Profile Mode parameter:
1. FixedRange Mode: Analyzes a single user-defined interval, such as a specific date range or the last N bars, suitable for macro-level, long-term support and resistance identification.
2. Periodic Mode: Automatically segments the chart into consecutive blocks of N bars, drawing a new profile for each. This mode supports micro-level and behavioral analysis by tracking how the Point of Control (POC) and Value Area evolve over time.
Common configurable settings include bin size (price resolution), volume type (tick volume or bar count), volume distribution method, value area percentage, and visual options such as histogram display and labeling. FixedRange and Periodic modes have distinct parameter groups to tailor their respective analyses.
Color and style options allow customization of POC, Value Area lines, and histogram appearance. The tool supports various markets including Forex, indices, commodities, stocks, and cryptocurrencies, as indicated by its relevant tags.
Opinie klientów
5 | 50 % | |
4 | 50 % | |
3 | 0 % | |
2 | 0 % | |
1 | 0 % |


