
Opis
Marketplace Pitch (krótko)
Volume Delta & CVD — Odczytuj agresywny przepływ w czasie rzeczywistym. Elastyczne resetowanie (Dzień/Tydzień/Miesiąc), opcjonalne wygładzanie EMA oraz nieprzemalowujący się skumulowany delta. Idealny do potwierdzania wybicia i wykrywania dywergencji.
Volume Delta & CVD — Przegląd i przewodnik po parametrach
Hasło: Mierz nierównowagę kupna/sprzedaży (Delta) oraz jej skumulowany przepływ (CVD) z elastycznym resetowaniem. Nieprzemalowujący się.
Przegląd
Volume Delta & CVD dla cTrader oblicza, dla każdej świecy, Deltę (agresywne kupno kontra sprzedaż) oraz CVD (Skumulowany Volume Delta). Pomaga odczytać presję przepływu zleceń, potwierdzić wybicia i zauważyć dywergencje względem ceny.
Uwaga: Wskaźnik używa TickVolume (standard cTrader) jako proxy wolumenu.
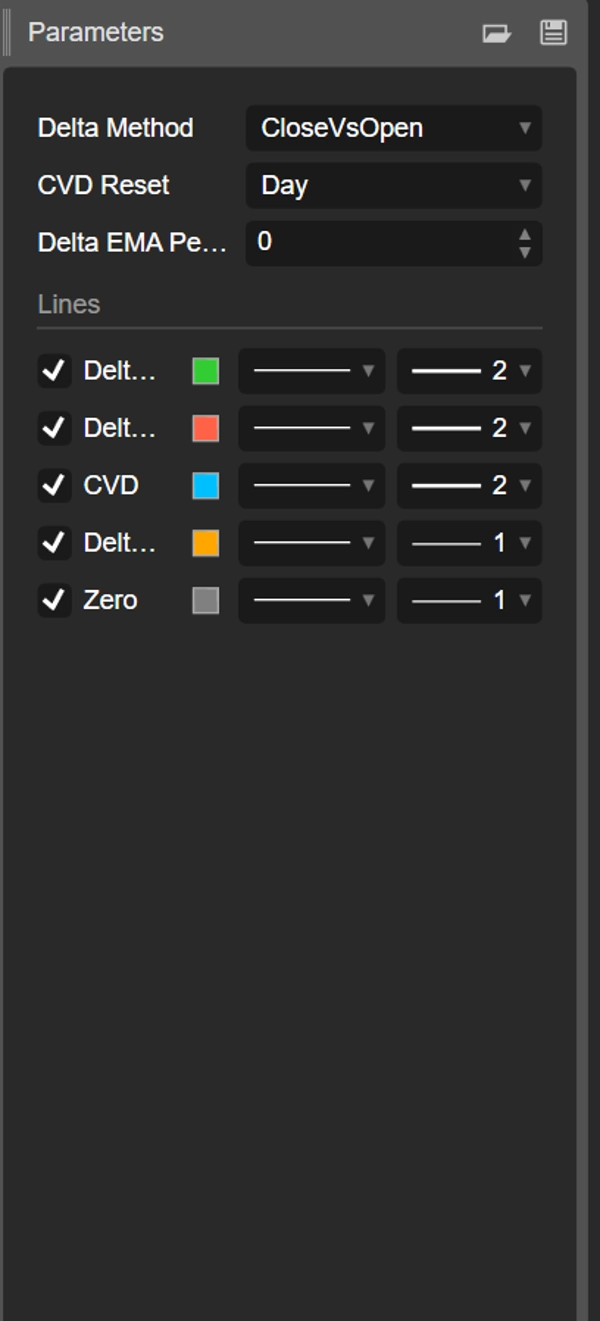
Parametry (szczegółowo)
Metoda Delta
Wybierz, jak szacowany jest kierunkowy przepływ świecy:
- CloseVsPrevClose
Delta = ±TickVolume w zależności od Close[t] vs Close[t-1].
Zalety: bardzo responsywna; świetna do zmian reżimu intraday. - CloseVsOpen
Delta = ±TickVolume w zależności od Close vs Open tej samej świecy.
Zalety: podkreśla kierunkowe świece; redukuje szumy między świecami. - Money Flow Multiplier (MFM)
MFM = ((Close−Low) − (High−Close)) / (High−Low)w [−1, +1]
Delta = MFM × TickVolume
Zalety: ważenie wewnątrz świecy; gładki/odporny na szumy przy szerokich zakresach.
Reset CVD
Kontroluje, kiedy licznik skumulowany jest resetowany:
- Brak: ciągły od początku wykresu.
- Dzień: resetuje się na każdy nowy dzień (bias intraday).
- Tydzień: resetuje się na każdy nowy tydzień (swing).
- Miesiąc: resetuje się na każdy nowy miesiąc (bias wyższego interwału czasowego).
Okres EMA dla Delty (0 = wyłączone)
- Stosuje EMA do Delty, aby wygładzić histogram i ujawnić zmiany reżimu.
- Sugestie: 5–9 skalping, 10–21 intraday, 21–34 swing.
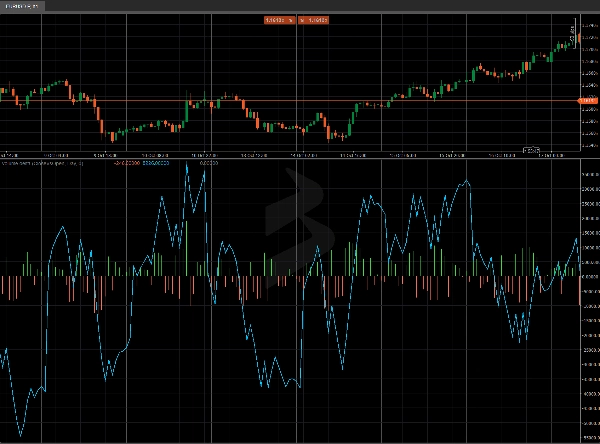
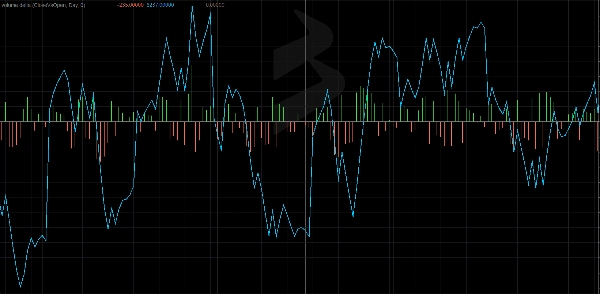
Wyniki / Bufory
- Delta Up (zielony histogram): dodatnia część Delty.
- Delta Down (czerwony histogram): ujemna część Delty.
- CVD (linia aqua): skumulowana suma Delty z wybranym resetem.
- Delta EMA (linia pomarańczowa, opcjonalna): wygładzona Delta.
- Zero (linia szara): linia bazowa do szybkiego porównania.
Jak to czytać
- Delta > 0 → dominacja agresywnego kupna w świecy.
- Delta < 0 → dominacja agresywnej sprzedaży w świecy.
- Rosnące CVD → akumulacja; malejące CVD → dystrybucja.
- Dywergencje
-
- Cena tworzy wyższe maksima podczas gdy CVD nie potwierdza → potencjalne wyczerpanie presji kupna.
- Cena tworzy niższe minima podczas gdy CVD nie potwierdza → potencjalne wyczerpanie presji sprzedaży.
Praktyczne scenariusze
- Potwierdzenie wybicia: preferuj długie wybicia, gdy CVD przyspiesza i Delta EMA staje się dodatnia.
- Korekta rozszerzeń: szukaj dywergencji ceny i CVD na kluczowych poziomach (VWAP/Anchored VWAP, S/R).
- Bias sesji: przy CVD Reset = Dzień odczytuj dominujący kierunek intraday.
Szybki start
- Dołącz wskaźnik.
- Zacznij od Metoda Delta = MFM, Reset CVD = Dzień, EMA = 10 (intraday).
- Na hałaśliwych wykresach zwiększ EMA lub przełącz na CloseVsOpen.
- Szukaj potwierdzenia z Anchored VWAP, statycznym/dynamicznym S/R lub formacjami price-action.
Wydajność i kompatybilność
- Nowoczesne API (
Bars.*,LineColor). - Obliczenia nieprzemalowujące się.
- Działa na dowolnym symbolu i interwale czasowym.
Podsumowanie
The indicator supports three Delta calculation methods: CloseVsPrevClose (responsive for intraday shifts), CloseVsOpen (reduces noise by focusing on directional bars), and Money Flow Multiplier (MFM) which weights intra-bar volume for smoother results. An optional Exponential Moving Average (EMA) smoothing can be applied to Delta to highlight regime changes.
Outputs include separate histograms for positive and negative Delta, the CVD line, an optional Delta EMA line, and a zero baseline for reference. Traders can use the indicator to confirm breakouts, identify divergences between price and volume flow, and assess order-flow pressure. It works on any symbol and timeframe, supporting markets such as Forex, indices, commodities, stocks, and cryptocurrencies.


