
Açıklama
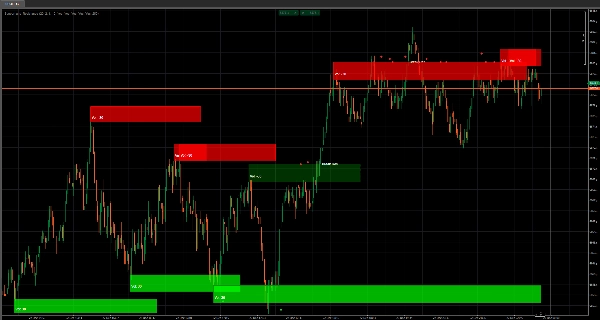
✅ Yüksek Hacimli Destek & Direnç Kutuları — gerçek “koruma / kırılma” bölgelerini otomatik olarak haritalar
✅ Hacim Ağırlıklı Bölge Gücü (dinamik opaklık) — daha yüksek hacim = daha güçlü kutu varlığı
✅ Pivot Tabanlı Bölge Oluşumu (Geriye Bakış) — sadece onaylanmış seviyeler bölge olur (daha az gürültü)
✅ Uyarlanabilir Kutu Genişliği (ATR tabanlı) — bölgeler sabit tahminler değil, mevcut volatiliteye göre ölçeklenir
✅ Canlı Kutu Uzatma — fiyat gelişirken bölgeler ileriye doğru projeksiyon yapmaya devam eder
✅ Kırılma / Tutma Zekası — bir bölgenin tutup tutmadığını veya kırıldığını algılar ve anında tepki verir
✅ Görsel Olay İşaretleri (Elmaslar) — fazla düşünmeden temiz “tutma / dönüş” onayları
✅ Kırılma Etiketleri — grafik üzerinde net “Destek Kırılması / Direnç Kırılması” olayları
✅ Tam Görsel Kontrol — Kutular / Hacim Metni / Elmaslar / Kırılma Etiketleri için açma-kapama seçenekleri
✅ Otomatik Temizleme Sistemi — eski olay işaretlerini otomatik kaldırarak grafik karmaşasını önler
✅ Maksimum Kutu Kontrolü — performansı hızlı tutmak ve grafikleri okunabilir kılmak için sert sınır
Destek & Direnç (Yüksek Hacimli Kutular) rastgele çizgiler çıkaran temel bir D/S aracı değildir.
Bu gösterge size çok daha değerli bir şey göstermek için tasarlanmıştır:
Fiyatın gerçek ilgi yarattığı yerler — ve tekrar tepki verme olasılığının en yüksek olduğu yerler.
“Güzel seviyeler” çizmek yerine, yüksek hacimli arz & talep bölgeleri olarak kutuları doğrudan grafiğinizde oluşturur, böylece yapıyı profesyonel gibi işlem yapabilirsiniz:
bölgeyi tanımla → tepkiyi izle → tutma veya kırılmayı işle.
Temel Avantaj: Tahmin değil, Hacim + Yapı
Her kutu yalnızca iki koşul uyduğunda oluşturulur:
- Onaylanmış bir pivot (yapı önemlidir)
- Bir hacim aşırılığı (ilgi önemlidir)
Bu, zayıf bölgelerle spamlenmediğiniz anlamına gelir.
Daha az bölge alırsınız — ama aldığınız bölgeler gerçekten önemli olanlardır.
Görebileceğiniz Güç (Opaklık = Güç)
Bu, “kör” D/S işlemi yapanlar için haksız hale gelir.
Kutu dolgu opaklığı hacimle ölçeklenir, böylece anında anlarsınız:
- Soluk kutu = hafif ilgi (izleyin)
- Güçlü kutu = yoğun ilgi (saygı gösterin)
Ekstra gösterge yok, yorum jimnastiği yok — tamamen görünür.
Volatiliteye Uyumlu Bölgeler (ATR Genişliği)
Piyasalar her gün aynı hareket etmez.
Bu gösterge, uzun bir ATR temel çizgisi kullanarak kutu kalınlığını ayarlar, böylece bölgeler volatiliteye göre genişler veya daralır.
Sonuç:
bölgeler gerçekçi kalır, çok ince olup önemsiz veya çok geniş olup işe yaramaz olmazlar.
Tutma ve Kırılma Zekası (ve Anlık Görsel Geri Bildirim)
Bir bölge ancak fiyatın onunla ne yaptığını okuyabilirseniz değerlidir.
Bu gösterge şunları takip eder:
- Tutmalar (reddetme / saygı)
- Kırılmalar (bölgeyi kabul etme)
…ve sonra stili canlı olarak günceller:
- Tutmalar orijinal “destek/direnç kimliğini” korur
- Kırılmalar davranışı değiştirir (destek direnç olabilir ve tersi)
- Kırılma stili kesikli + yeni renk tonuna geçebilir, böylece anında anlarsınız:
“Bu seviye karakterini değiştirdi.”
Elmaslar + Kırılma Etiketleri: Temiz karar tetikleyicileri
Basit, yüksek sinyal olay işaretleri alırsınız:
- Elmaslar tutma/dönüş olaylarını vurgulamak için
- Kırılma etiketleri bir seviyenin aniden kırıldığı anı kaçırmamanız için
Bir şeyin kırıldığını düşünmek ile bilmek arasındaki fark budur.
Gerçek İşlem İçin Tasarlandı: Kontrol + Temiz Grafikler
Bu gösterge, saatlerce işlem yaptıktan sonra bile kullanılabilir kalacak şekilde tasarlanmıştır:
- Sadece bölgeler mi istiyorsunuz? Elmasları/etiketleri kapatın.
- Saf sinyaller mi istiyorsunuz? Hacim metnini kapatın.
- Performans mı istiyorsunuz? Maksimum Kutular sınırlandırın.
- Karmaşadan nefret mi ediyorsunuz? Otomatik Temizleme Olayları eski işaretleri otomatik kaldırarak grafiği temiz tutar.
Mevcut mücadeleye odaklanırsınız — tarihin içinde boğulmazsınız.
Önerilen Ayar (Hızlı Başlangıç)
✅ Geriye Bakış Dönemi: 20 (dengeli onay)
✅ Hacim Filtre Uzunluğu: 2 (duyarlı)
✅ Kutu Genişliği Çarpanı: 1.0 (nötr)
✅ Kutuları Göster: AÇIK
✅ Elmaslar + Kırılma Etiketleri: AÇIK (davranışı öğrenene kadar, sonra iyileştirin)
✅ Otomatik Temizleme Olayları: AÇIK (temiz tutun)
Bu gösterge size gerçekten ne verir
Piyasanın elini gösterdiği yerlerin görsel haritasını — ve fiyatın o bölgeyi saygı gösterip göstermediğine veya yok ettiğine dair canlı bir okuma.
Kırılmaları, geri çekilmeleri, dönüşleri veya yeniden testleri işliyorsanız:
bu sizin “savaş alanı örtünüz” olur.
Özet
The indicator adapts box width based on average true range (ATR), ensuring zones scale with current market volatility. It continuously projects zones forward as price evolves, offering live updates on whether zones hold (support/resistance) or break (flip behavior). Visual markers such as diamonds and break labels signal hold and breakout events, enabling traders to quickly interpret market reactions without ambiguity.
Users can customize visual elements including boxes, volume text, event marks, and set limits on the number of boxes to maintain chart clarity and performance. An auto-clean system removes outdated event marks to prevent clutter. This tool supports trading across various markets including forex, indices, commodities, stocks, and cryptocurrencies, and is suitable for strategies involving breakouts, pullbacks, reversals, and retests.


!["[Stellar Strategies] Inside Bar with Signals" logosu](https://cdn.ctrader.com/image/webp/1d9e8bfa-3b2c-4440-bb37-5856902008a7_30683)


