
Açıklama
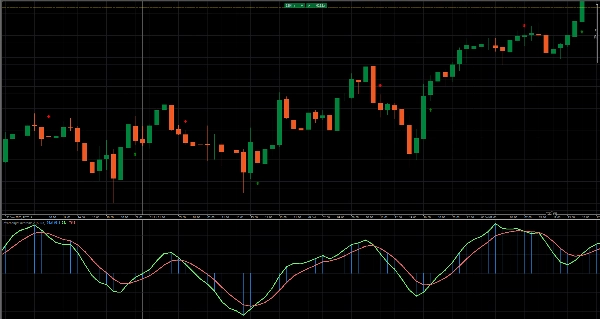
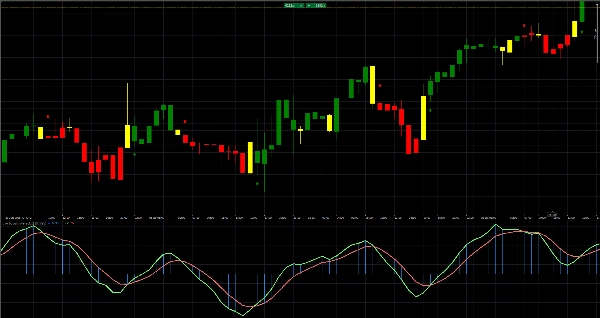
✅ Normalleştirilmiş momentum ile aşırı alım ve aşırı satım koşullarını tanımlar
✅ Kararlı sinyal üretimi için düzleştirilmiş EMA tabanlı merkezi fiyat kullanır
✅ Momentumu görselleştirmek için çift histogramlar (Oo & Ll) gösterir
✅ Renk kodlu çubuklar anında boğa, ayı veya kararsız aşamaları gösterir
✅ Kesin AL ve SAT noktalarını katı kesişim oklarıyla işaretler
Zamanlamanızı Aşırı Alım / Aşırı Satım Göstergesi ile yükseltin: EMA aracılığıyla düzleştirilmiş merkezi fiyatı (ys1) hesaplar, momentumu standart sapma ile normalleştirir ve yukarı/aşağı EMA çizgileriyle birlikte çift histogramlar (Oo & Ll) çizer. Renk kodlu çubuklar, boğa (yeşil), ayı (kırmızı) veya kararsız (sarı) momentum değişimlerini anında vurgular, katı kesişim okları ise kesin alım ve satım noktalarını işaretler. Bu örtüyü grafiğinize ekleyerek kristal netliğinde aşırı alım/aşırı satım sinyalleri elde edin ve girişlerinizi ve çıkışlarınızı güvenle zamanlayın!
Ayrıca CBOT olarak da mevcuttur overbought oversold cbot cBot - cTrader Store
Özet
Müşteri değerlendirmeleri
5 | 100 % | |
4 | 0 % | |
3 | 0 % | |
2 | 0 % | |
1 | 0 % |


