
Deskripsi
SR COMMANDER — Edisi Multi Timeframe
Lihat di mana uang besar menarik garis. Berdagang pada timeframe Anda. Berpikir pada mereka.
Sebagian besar alat support dan resistance terikat pada timeframe grafik Anda. Jika Anda scalping di M1, level S/R Anda berasal dari candle M1 — kecil, berisik, dan mudah dipalsukan. SR Commander MTF memutus rantai itu.
Atur grafik Anda ke M1. Atur timeframe SR Anda ke H1. Sekarang Anda scalping dengan presisi grafik satu menit, tetapi level support dan resistance Anda diambil dari candle per jam di mana institusi, algoritma, dan trader profesional benar-benar membuat keputusan mereka. Itulah keunggulannya.
CARA KERJA MESIN MULTI TIMEFRAME
Indikator menjalankan dua aliran data independen secara bersamaan.
Timeframe grafik Anda mengontrol apa yang Anda lihat — candle Anda, entri Anda, panah Anda, waktu Anda. Timeframe SR Anda mengontrol dari mana level berasal. Kedua aliran ini dipetakan satu sama lain secara real time, bar demi bar. Ketika candle grafik baru ditutup, SR Commander mencari candle timeframe SR yang tepat untuk momen itu dan menghitung ulang level dari struktur timeframe yang lebih tinggi tersebut.
Ini berarti garis support hijau dan garis resistance merah Anda selalu mencerminkan struktur berbobot volatilitas dari timeframe SR yang Anda pilih — bukan kebisingan grafik yang Anda tonton.
ILMU DI BALIK LEVEL
SR Commander tidak hanya menggambar garis pada swing high dan low. Ia menggunakan model volatilitas Yang-Zhang — kelas estimator volatilitas yang sama yang digunakan dalam riset kuantitatif profesional — untuk menghitung bobot statistik sebenarnya dari setiap candle. Setiap level berasal dari struktur harga yang dinormalisasi, memperhitungkan gap semalam, pergerakan open-to-close, dan rentang intrabar. Hasilnya adalah level yang membawa makna matematis nyata, bukan hanya penonjolan visual.
APA YANG ANDA LIHAT DI GRAFIK
- 🟢 Garis support hijau — lantai signifikan secara statistik terdekat di bawah harga saat ini, diambil dari timeframe SR yang Anda pilih
- 🔴 Garis resistance merah — langit-langit signifikan secara statistik terdekat di atas harga saat ini, diambil dari timeframe SR yang Anda pilih
- ⬆️ Sinyal BELI — muncul saat harga memantul dari support dengan penutupan bullish yang dikonfirmasi pada candle timeframe SR
- ⬇️ Sinyal JUAL — muncul saat harga menolak resistance dengan penutupan bearish yang dikonfirmasi pada candle timeframe SR
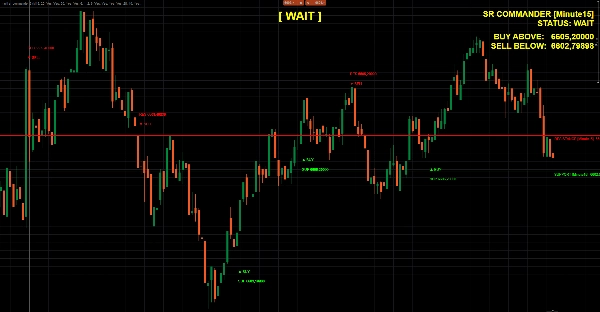
- 📊 Dashboard langsung — menunjukkan timeframe SR aktif, status saat ini, dan harga trigger breakout yang tepat
- 🔵 Label status besar — BELI / JUAL / TUNGGU, diperbarui setiap bar di bagian atas tengah grafik Anda
- 🕓 Overlay historis — pantulan, penolakan, breakout, dan breakdown ditandai di grafik untuk validasi visual instan
KOMBINASI TIMEFRAME YANG BERFUNGSI
Chart TFSR TimeframeUse Case
M1
M5 atau M15
Scalping cepat dengan struktur jangka pendek
M5
H1
Perdagangan intraday dengan level per jam
M15
H4
Entri swing dengan struktur 4 jam
H1
D1
Perdagangan posisi berdasarkan S/R harian
Apa saja
Grafik
Mode klasik — perilaku TF tunggal asli
FITUR
- Mesin multi timeframe penuh — waktu SR apa pun pada waktu grafik apa pun
- Perhitungan level dinormalisasi volatilitas Yang-Zhang
- Inklusi candle terbesar — selalu menangkap candle struktur dominan dari periode lookback
- Logika sinyal pantulan dan penolakan dengan toleransi dan buffer yang dapat dikonfigurasi
- Deteksi breakout dan breakdown dengan buffer yang dapat disesuaikan
- Overlay sinyal historis untuk validasi berbasis grafik langsung
- Dashboard dan label status besar dengan ukuran font dan warna yang sepenuhnya dapat disesuaikan
- Zero repaint — semua sinyal berdasarkan candle yang sudah ditutup saat mode konfirmasi aktif
SIAPA YANG DITUJU?
Trader yang memahami bahwa entri terbaik ada di timeframe lebih rendah, tetapi level terbaik ada di timeframe lebih tinggi. Jika Anda pernah menggambar level H4 secara manual saat trading M5 — SR Commander mengotomatisasi seluruh proses itu, menjaga agar tetap berdasar secara matematis, dan menempatkan sinyal tepat di grafik Anda saat harga bereaksi.
Struktur timeframe lebih tinggi. Presisi timeframe lebih rendah. Satu indikator.
Ringkasan
The indicator calculates S/R levels using the Yang-Zhang volatility model, which accounts for overnight gaps, open-to-close movement, and intrabar range to produce statistically significant levels rather than simple swing highs and lows. On the chart, it shows a green support line and a red resistance line representing the nearest significant levels below and above the current price from the chosen S/R timeframe.
Additional features include buy and sell signals triggered by price reactions to these levels confirmed on the S/R timeframe, a live dashboard displaying current status and breakout prices, a large status label indicating BUY, SELL, or WAIT, and historical overlays marking past bounces, rejections, and breakouts. The indicator supports various timeframe combinations suitable for scalping, intraday, swing, and position trading across markets including forex, indices, commodities, stocks, and crypto.
Ulasan pelanggan
5 | 50 % | |
4 | 50 % | |
3 | 0 % | |
2 | 0 % | |
1 | 0 % |


