
Deskripsi
✅ Mengidentifikasi kondisi jenuh beli & jenuh jual dengan momentum yang dinormalisasi
✅ Menggunakan harga tengah berbasis EMA yang halus untuk menghasilkan sinyal yang stabil
✅ Menampilkan dua histogram (Oo & Ll) untuk memvisualisasikan tekanan momentum
✅ Batang berwarna menunjukkan secara instan fase bullish, bearish, atau ragu-ragu
✅ Menandai titik BELI & JUAL yang tepat dengan panah crossover yang ketat
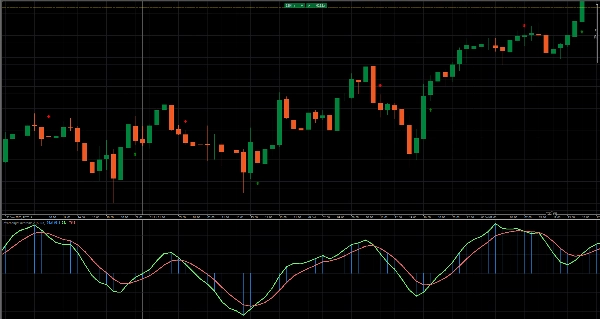
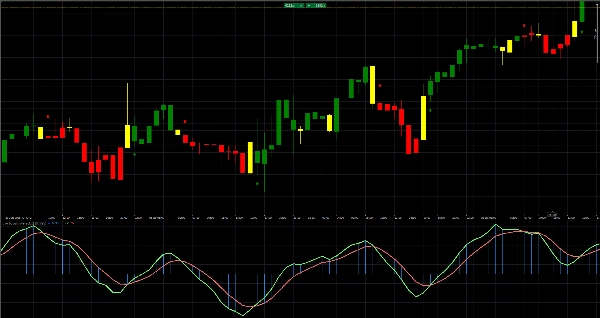
Tingkatkan timing Anda dengan Indikator Jenuh Beli / Jenuh Jual: indikator ini menghitung harga tengah yang halus (ys1) melalui EMA, menormalkan momentum melalui deviasi standar, dan memplot dua histogram (Oo & Ll) bersama garis EMA naik/turun. Batang berwarna menyoroti secara instan pergeseran momentum bullish (hijau), bearish (merah), atau ragu-ragu (kuning), sementara panah crossover yang ketat menandai titik beli dan jual yang tepat. Tambahkan overlay ini ke grafik Anda untuk sinyal jenuh beli/jenuh jual yang sangat jelas dan dengan percaya diri menentukan waktu masuk dan keluar Anda!
Juga tersedia sebagai CBOT overbought oversold cbot cBot - cTrader Store
Ringkasan
Ulasan pelanggan
5 | 100 % | |
4 | 0 % | |
3 | 0 % | |
2 | 0 % | |
1 | 0 % |


