
VegaXLR - ZigZag Alerts
Indikator
9 pembelian
Versi 1.0, Feb 2025
Windows, Mac
4.3
Ulasan: 3
Deskripsi
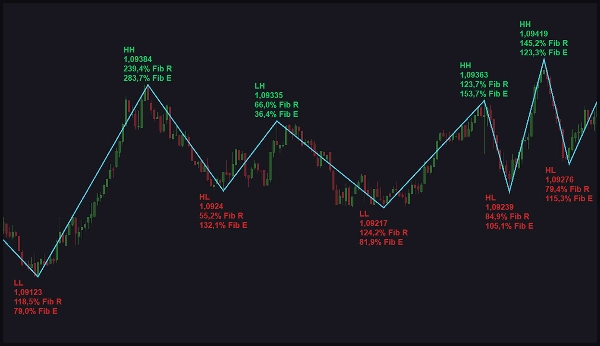
Indikator cTrader ZigZag Alerts membantu Anda melacak ayunan harga dengan menggambar Higher Highs, Higher Lows, Lower Lows, dan lainnya. Ini juga menghitung retracement dan ekspansi Fibonacci dengan membandingkan ayunan. Garis ZigZag tetap konsisten di semua simbol, kerangka waktu, dan rentang harga untuk analisis yang dapat diandalkan.
Fitur Utama:
- Sensitivitas yang Dapat Disesuaikan: Sesuaikan bagaimana indikator mendeteksi ayunan berdasarkan kondisi pasar.
- Opsi Label: Pilih antara label singkat atau lengkap untuk visualisasi yang jelas.
- Kustomisasi Font & Warna: Ubah ukuran teks dan tentukan warna bullish/bearish untuk keterbacaan yang lebih baik.
- Label & Harga Ayunan: Tampilkan label ayunan dengan harga yang sesuai untuk wawasan yang lebih baik.
- Level Fibonacci: Lihat level retracement dan ekspansi Fibonacci untuk titik masuk dan keluar yang lebih baik.
- Manajemen Peringatan: Jeda semua peringatan secara instan saat diperlukan.
- Komentar Kustom: Tambahkan komentar yang muncul dalam peringatan untuk identifikasi mudah.
- Beberapa Opsi Peringatan: Terima peringatan melalui suara, pop-up, Telegram, atau email.
- Peringatan Spesifik Ayunan: Dapatkan peringatan untuk jenis ayunan yang dipilih dan jeda peringatan untuk waktu tertentu.
- Peringatan Fibonacci: Tetap terinformasi dengan peringatan pada retracement dan ekspansi Fibonacci.
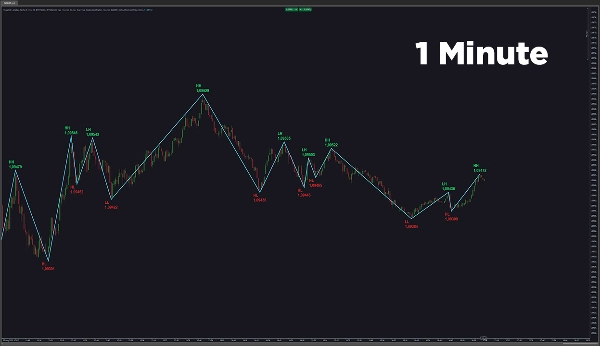
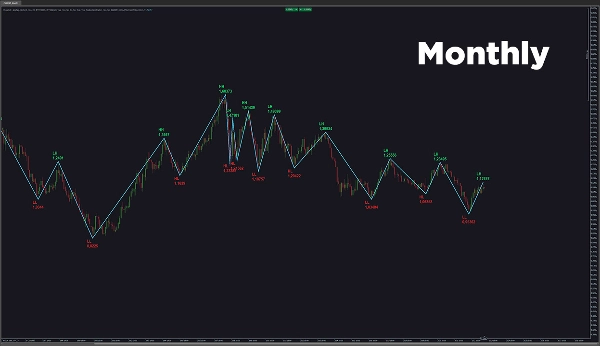
- Garis ZigZag yang Konsisten: Berbeda dengan indikator lain, ini mempertahankan deteksi ayunan yang seragam di semua kerangka waktu dan rentang harga.
- Panduan Pengguna: Anda dapat dengan cepat mengakses panduan pengguna melalui tombol di grafik.
cTrader ZigZag Alerts menyediakan deteksi ayunan yang tepat dan kustomisasi peringatan, membantu trader membuat keputusan yang tepat dengan percaya diri.
Ringkasan
Ringkasan AI
VegaXLR - ZigZag Alerts is a cTrader indicator designed for precise price swing analysis. It identifies and plots key swing points such as Higher Highs, Higher Lows, and Lower Lows, maintaining consistent ZigZag lines across all symbols, timeframes, and price ranges. The indicator calculates Fibonacci retracement and expansion levels by comparing swings, aiding in identifying potential entry and exit points.
Key features include adjustable sensitivity for swing detection tailored to market conditions, customizable label formats (abbreviated or full), and font and color settings to distinguish bullish and bearish swings. Swing labels display corresponding prices for enhanced clarity. Alert management options allow users to pause alerts instantly, add custom comments for easy identification, and receive notifications via sound, pop-ups, Telegram, or email. Alerts can be configured for specific swing types and Fibonacci levels, with the ability to pause alerts temporarily.
A user guide is accessible directly from the chart for quick reference. This indicator supports traders in monitoring market swings and Fibonacci levels with customizable alerts to facilitate informed trading decisions.
Profil indikator
Ulasan pelanggan
4.3
Ulasan: 3
5 | 33 % | |
4 | 67 % | |
3 | 0 % | |
2 | 0 % | |
1 | 0 % |
Ulasan pelanggan
February 15, 2025
Simple but not useless around swing point analysis. The useful part is reviewing reversals, pullbacks and swing zones, with the numbers checked before scaling. I would test 20 swing signals and ignore setups where the stop is wider than the 1.5R target. The level is useful when it supports the market story.
February 14, 2025
February 14, 2025
Fair pick for discipline if the trader wants it helps identify turning points and cleaner structure. It works best as support, not a final decision maker. Swing points look better after 3 pivots, especially when the 0.5 Fib area agrees with structure. the signal still needs broader context.
Diskusi
Pertanyaan umum
Forex
Produk-produk yang tersedia melalui cTrader Store, termasuk bot trading, indikator, dan plugin, disediakan oleh pengembang pihak ketiga serta hanya ditujukan untuk akses teknis dan informasi. cTrader Store bukan broker dan tidak menyediakan saran investasi, rekomendasi pribadi, atau jaminan apa pun tentang kinerja di masa mendatang.


![Logo "[Hamster-Coder] Pivot Points MTF"](https://cdn.ctrader.com/image/webp/4c143e5a-309c-40e3-a578-f04d1e133ffa_31159)


Harga
215
Penjualan
680
Instal gratis