
PriceLevels
Indikator
4 pembelian
Versi 1.0, Jan 2025
Windows, Mac
5.0
Ulasan: 2
Deskripsi
Fitur Utama:
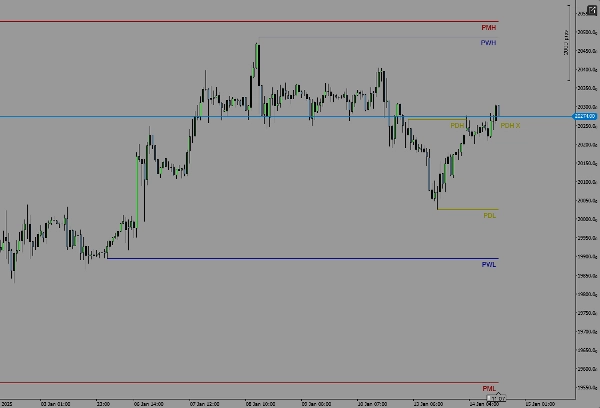
- Menampilkan level tertinggi dan terendah kemarin.
- Menampilkan level tertinggi dan terendah minggu lalu.
- Menampilkan level tertinggi dan terendah bulan lalu.
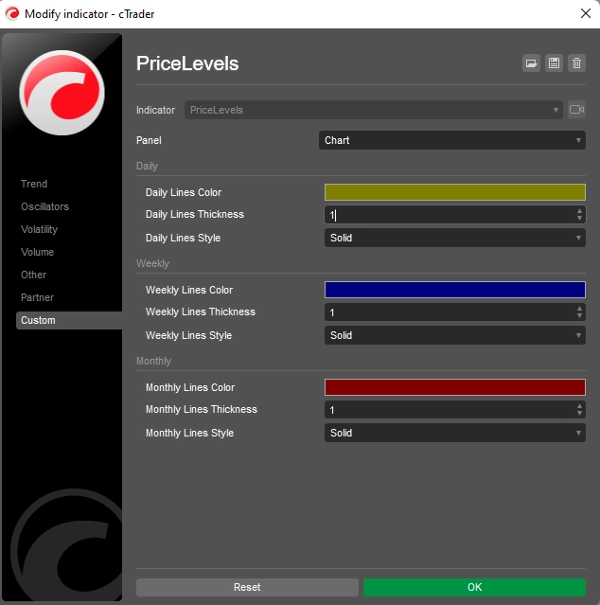
- Warna dan gaya garis yang dapat disesuaikan untuk setiap level.
Cara Kerja:
Indikator secara otomatis menghitung harga tertinggi dan terendah untuk hari, minggu, dan bulan sebelumnya berdasarkan kerangka waktu grafik Anda. Level-level ini kemudian digambarkan sebagai garis horizontal pada grafik Anda, memberikan referensi visual yang jelas untuk aksi harga historis.
Kompatibilitas:
- Dirancang khusus untuk platform cTrader.
- Bekerja pada semua kerangka waktu dan instrumen.
Jika Anda memiliki pertanyaan, masukan, atau saran untuk perbaikan, jangan ragu untuk menghubungi! Masukan Anda sangat berharga dan akan membantu membuat indikator ini menjadi lebih baik.
Selamat berdagang!
Ringkasan
Ringkasan AI
PriceLevels is an indicator designed for the cTrader platform that automatically calculates and displays key historical price levels on trading charts. It plots the highest and lowest prices from the previous day, last week, and last month as horizontal lines, providing traders with clear visual references for past price action. The indicator supports all timeframes and instruments available on cTrader. Users can customize the colors and line styles for each displayed level to suit their charting preferences. This tool aids in identifying significant support and resistance zones based on recent historical data.
Profil indikator
Ulasan pelanggan
5.0
Ulasan: 2
5 | 100 % | |
4 | 0 % | |
3 | 0 % | |
2 | 0 % | |
1 | 0 % |
Diskusi
Pertanyaan umum
Produk-produk yang tersedia melalui cTrader Store, termasuk bot trading, indikator, dan plugin, disediakan oleh pengembang pihak ketiga serta hanya ditujukan untuk akses teknis dan informasi. cTrader Store bukan broker dan tidak menyediakan saran investasi, rekomendasi pribadi, atau jaminan apa pun tentang kinerja di masa mendatang.


Harga
Sejak 05/01/2025
14
Penjualan