
Vision - Advanced Session Indicator
Indikator
6 pembelian
Versi 1.0, Jul 2025
Windows, Mac
5.0
Ulasan: 2
Deskripsi
Indikator Sesi Lanjutan
Deskripsi:
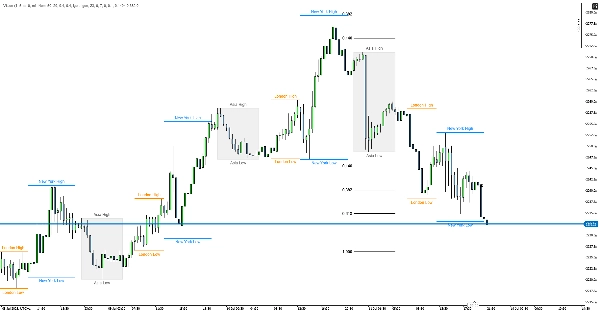
Indikator sesi profesional untuk cTrader yang menampilkan rentang harga dari sesi perdagangan utama dan menambahkan analisis profil volume untuk setiap sesi.
Fitur Utama:
📊 Kotak dan Garis Harga Sesi
- 4 sesi perdagangan utama: Asia, Frankfurt, London, New York
- Waktu yang sepenuhnya dapat disesuaikan: Setiap sesi dapat dikonfigurasi secara terpisah
- Kotak dan garis rentang harga berwarna: Menampilkan nilai tertinggi/terendah secara visual untuk setiap sesi
- Penanganan zona waktu otomatis
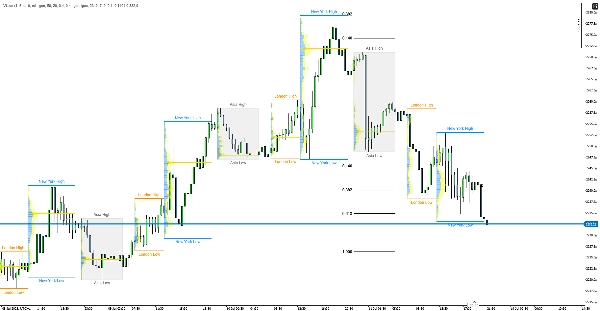
📈 Profil Volume Sesi
- Tampilan distribusi volume: Profil volume terpisah untuk setiap sesi
- Volume Beli/Jual: Warna terpisah (biru/kuning)
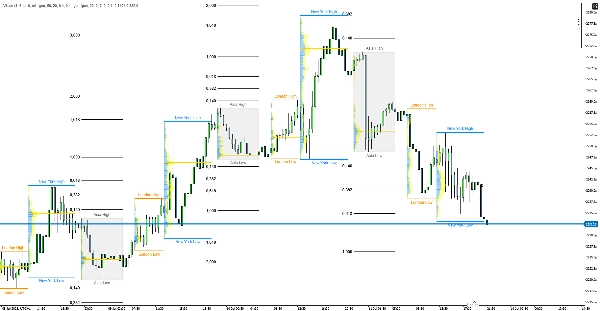
- POC (Point of Control): Menandai level harga volume tertinggi
- Resolusi yang dapat disesuaikan: Histogram volume dengan level 10-500
Pengaturan
Waktu Sesi
- Asia: 23:00-07:00 (Abu-abu)
- Frankfurt: 07:00-08:00 (Hijau Tua)
- London: 09:00-14:00 (Oranye)
- New York: 14:00-22:00 (Biru)
Opsi yang Dapat Disesuaikan
- Transparansi dan warna kotak serta garis
- Variasi perpanjangan sesi Asia
- Lebar dan transparansi histogram volume
- Jumlah hari yang ditampilkan
- Tampilan garis POC
- Kerangka waktu terpisah untuk kotak sesi dan profil volume
Penggunaan
Aplikasi Perdagangan:
- Level tertinggi/terendah sesi sebagai titik S/R
- Klaster volume untuk menandai level signifikan
- Garis POC sebagai level magnetik
- Tumpang tindih sesi dengan penekanan penting
Keunggulan: Gabungan analisis aksi harga dan volume, pembaruan waktu nyata, kustomisasi penuh, tampilan profesional.
Ringkasan
Ringkasan AI
Vision - Advanced Session Indicator is a professional tool designed for the cTrader platform to visualize and analyze major trading sessions: Asia, Frankfurt, London, and New York. It displays session price ranges using color-coded boxes and lines, highlighting high and low values for each session. The indicator supports full customization of session times, colors, transparency, and display settings, including separate timeframes for session boxes and volume profiles.
Key features include a session volume profile that shows volume distribution with distinct buy/sell volume colors and marks the Point of Control (POC), the price level with the highest traded volume. Users can customize the volume histogram resolution from 10 to 500 levels. The indicator automatically handles time zones and adjusts for Daylight Saving Time to ensure accurate session tracking.
Vision aids traders by marking session high/low levels as support and resistance points, identifying volume clusters and liquidity zones, and highlighting session overlaps. It is particularly useful for day traders seeking detailed insights into market behavior and potential entry levels based on volume and price action across different trading sessions.
Profil indikator
Ulasan pelanggan
5.0
Ulasan: 2
5 | 100 % | |
4 | 0 % | |
3 | 0 % | |
2 | 0 % | |
1 | 0 % |
Ulasan pelanggan
July 27, 2025
The entry needs one more reason to make sense, but the market context still matters.
July 15, 2025
The practical angle is weak trade ideas become less attractive, and signal count matters more than one nice example.
Diskusi
Pertanyaan umum
Prop
Forex
Indices
Crypto
Produk-produk yang tersedia melalui cTrader Store, termasuk bot trading, indikator, dan plugin, disediakan oleh pengembang pihak ketiga serta hanya ditujukan untuk akses teknis dan informasi. cTrader Store bukan broker dan tidak menyediakan saran investasi, rekomendasi pribadi, atau jaminan apa pun tentang kinerja di masa mendatang.


Harga
Sejak 05/01/2025
14
Penjualan