
LT_Ind_TradeNet
مؤشر
1 عمليات الشراء
الإصدار 1.0، Oct 2025
Windows, Mac
5.0
التقييمات: 1
الوصف
ملاحظة: تم الاختبار على cTrader لنظام ويندوز فقط.
LT_Ind_TradeNet هو مؤشر مخصص لتتبع الأرباح لرمز تداول واحد.
يساعد المتداولين على البقاء منضبطين من خلال إظهار مقدار ما كسبوه لليوم الحالي، والأسبوع، والشهر — مفصولًا إلى حالات تداول واضحة.
الحالات
- NoTrade – لا توجد مراكز مفتوحة
- Fresh – صفقات جديدة نحو هدف اليوم
- Manage – إدارة الصفقات الحالية أو المتداخلة
- Leftover – الصفقات المتبقية بعد تحقيق الهدف أو نهاية الجلسة
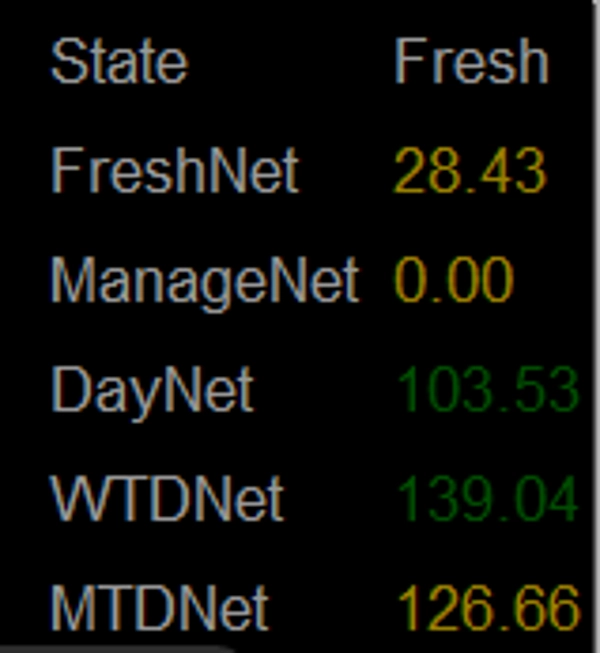
المقاييس المعروضة
- FreshNet – صافي الربح من صفقات الجانب الواحد
- ManageNet – صافي الربح من جميع الصفقات المتداخلة (كلا الجانبين)
- DayNet – إجمالي الربح لليوم الحالي
- WTDNet – الربح منذ بداية الأسبوع
- MTDNet – الربح منذ بداية الشهر
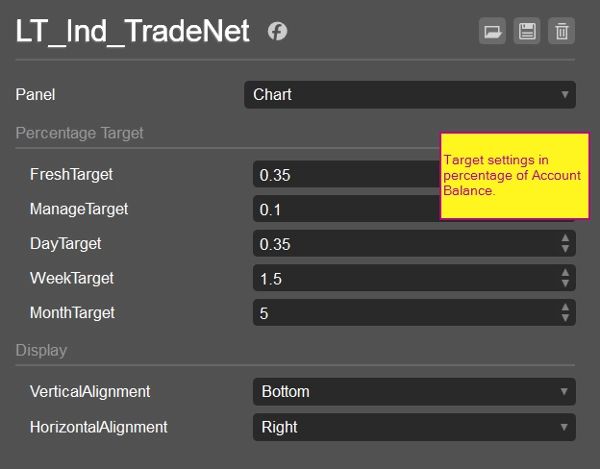
الغرض
- يحافظ على تركيز المتداولين على أهداف يومية أو أسبوعية واقعية
- يقلل السلوك العاطفي والجشع من خلال تحديد نقطة "كفاية" واضحة
- يوفر تغذية راجعة بسيطة لاتخاذ قرار الاستمرار في التداول أو التوقف للجلسة
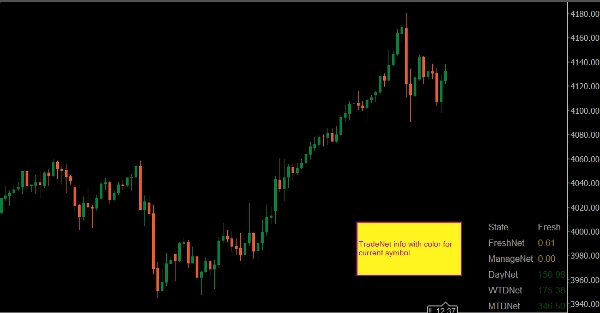
النقاط البارزة
- مخصص للرمز: كل مخطط يعرض أدائه الخاص
- خفيف الوزن وغير متداخل
- مثالي للمتداولين المباشرين الذين يتبعون أهداف ربح يومية/أسبوعية منظمة
المبدأ الأساسي:
الكفاية هي النقطة الأساسية للفوز.
الملخص
ملف تعريف المؤشر
تقييمات العملاء
5.0
التقييمات: 1
5 | 100 % | |
4 | 0 % | |
3 | 0 % | |
2 | 0 % | |
1 | 0 % |
مناقشة
الأسئلة الشائعة
Prop
Forex
Indices
Commodities
Crypto
Stocks
يتم توفير المنتجات المتاحة من خلال cTrader Store، بما في ذلك روبوتات التداول والمؤشرات والإضافات، من قبل مطوري الطرف الثالث وإتاحتها لأغراض الوصول المعلوماتي والفني فقط. cTrader Store ليس وسيطًا ولا يقدم نصائح استثمارية أو توصيات شخصية أو أي ضمان للأداء المستقبلي.


![شعار "[Stellar Strategies] Inside Bar with Signals"](https://cdn.ctrader.com/image/webp/1d9e8bfa-3b2c-4440-bb37-5856902008a7_30683)


السعر
منذ 25/09/2024
34
المبيعات