
Deskripsi
Catatan: Diuji hanya pada cTrader Windows.
LT_Ind_Pivot adalah indikator Pivot Point yang kuat dan dapat disesuaikan untuk cTrader yang membantu memvisualisasikan level pasar utama dan struktur sesi di berbagai kerangka waktu.
Indikator ini secara otomatis menghitung dan menggambar Pivot (P), Support (S1–S5), Resistance (R1–R5), dan CPR (TC/BC) berdasarkan kerangka waktu Anchor yang Anda pilih — dari H1, H4, H8, H12, D1, W1, hingga Month1.
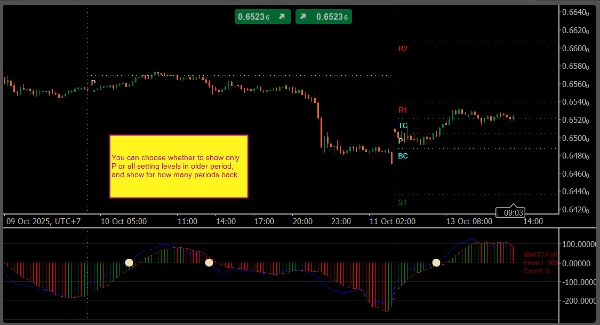
Indikator ini juga menggambar garis pemisah vertikal untuk setiap periode anchor, baik pada grafik utama maupun panel indikator, sehingga memudahkan membedakan batas sesi atau periode.
Anda dapat menentukan dengan tepat level mana yang akan ditampilkan menggunakan notasi fleksibel seperti:
P, S1, R1– level standarPS1,S1S2,R1R2, dll. – level tengah antara pivot dan support/resistance utamaTC,BC– Central Pivot Range (CPR)
Kontrol tampilan memungkinkan Anda mengatur berapa banyak pivot historis yang tetap terlihat, apakah menampilkan label teks/harga, dan bagaimana memberi warna atau gaya pada setiap level.
Fitur Utama
- Anchor pivot: H1, H4, H8, H12, D1, W1, Month1
- Sintaks level kustom:
P, Sx, Rx, PS1, S1S2, R1R2, TC, BC - Pemisah periode vertikal pada grafik dan panel indikator
- Opsi untuk menampilkan teks, harga, dan level pivot lama
- Kustomisasi penuh warna dan gaya garis
- Ringan dan cocok untuk trading langsung
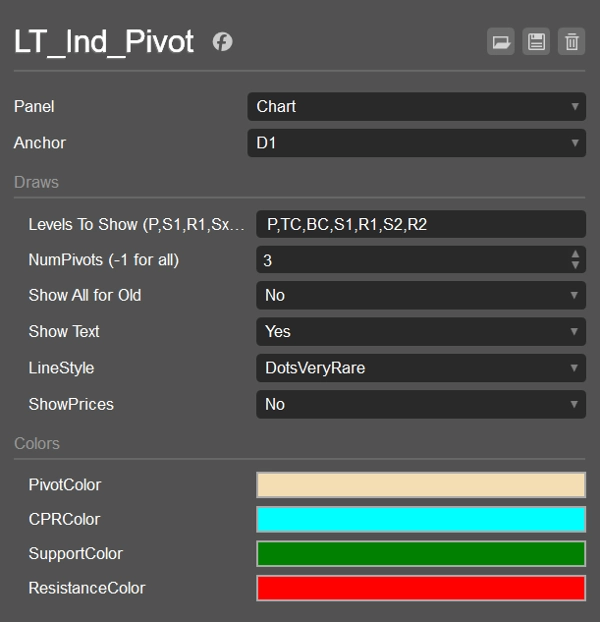
Pengaturan Default
- Anchor: D1
- Tampilkan Level:
P,S1,R1 - NumPivotsBack: 1
- ShowAllForOldPivots: false
- Tampilkan Teks: true
- Tampilkan Harga: false
- Gaya Garis: Solid
- Warna: Pivot = Wheat, CPR = Cyan, Support = Green, Resistance = Red
Kasus Penggunaan
- Menandai zona support/resistance intraday dan swing
- Melacak CPR dan level tengah untuk setup breakout atau mean-reversion
- Menggunakan pemisah periode untuk menganalisis struktur sesi per sesi
- Menggabungkan dengan indikator VWAP atau Swing untuk konfluensi yang lebih tinggi
Ringkasan
Ulasan pelanggan
5 | 0 % | |
4 | 100 % | |
3 | 0 % | |
2 | 0 % | |
1 | 0 % |


