
Deskripsi
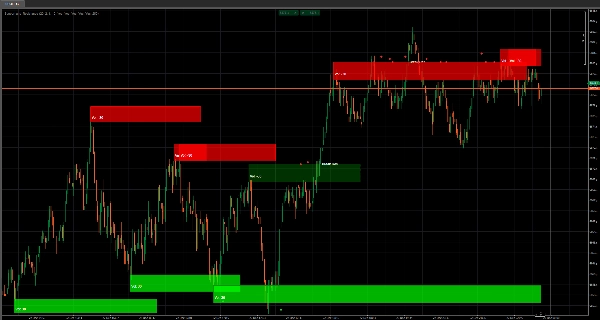
✅ Kotak Dukungan & Perlawanan Volume Tinggi — secara otomatis memetakan zona “pertahanan / tembus” nyata
✅ Kekuatan Zona Berbobot Volume (opasitas dinamis) — volume lebih kuat = kehadiran kotak lebih kuat
✅ Pembuatan Zona Berbasis Pivot (Lookback) — hanya level yang terkonfirmasi menjadi zona (lebih sedikit gangguan)
✅ Lebar Kotak Adaptif (berbasis ATR) — zona menyesuaikan dengan volatilitas saat ini, bukan tebakan tetap
✅ Perpanjangan Kotak Langsung — zona terus memproyeksikan ke depan seiring perkembangan harga
✅ Intelijen Tembus / Tahan — mendeteksi kapan zona bertahan vs. tembus dan bereaksi secara instan
✅ Tanda Acara Visual (Berlian) — konfirmasi “tahan / balik” yang bersih tanpa berlebihan
✅ Label Tembus — acara “Break Sup / Break Res” yang jelas di grafik
✅ Kontrol Visual Penuh — pengalih untuk Kotak / Teks Volume / Berlian / Label Tembus
✅ Sistem Pembersihan Otomatis — mencegah kekacauan grafik dengan menghapus tanda acara lama secara otomatis
✅ Kontrol Maks Kotak — batas keras untuk menjaga kinerja cepat dan grafik mudah dibaca
Dukungan & Perlawanan (Kotak Volume Tinggi) bukan alat S/R dasar yang menghasilkan garis acak.
Indikator ini dibuat untuk menunjukkan sesuatu yang jauh lebih berharga:
Di mana harga menciptakan minat nyata — dan di mana kemungkinan besar akan bereaksi lagi.
Alih-alih menggambar “level cantik,” ini membangun zona pasokan & permintaan volume tinggi sebagai kotak langsung di grafik Anda, sehingga Anda dapat berdagang struktur seperti profesional:
identifikasi zona → amati reaksinya → perdagangkan tahanan atau tembusannya.
Keunggulan Inti: Volume + Struktur, bukan tebakan
Setiap kotak dibuat hanya ketika dua kondisi terpenuhi:
- Pivot yang terkonfirmasi (struktur penting)
- Ekstrem volume (minat penting)
Itu berarti Anda tidak dibanjiri dengan zona lemah.
Anda mendapatkan lebih sedikit zona — tapi zona yang Anda dapatkan adalah zona yang benar-benar penting.
Kekuatan yang Bisa Anda Lihat (Opasitas = Kekuatan)
Di sinilah menjadi tidak adil bagi orang yang berdagang S/R “buta.”
Opasitas isi kotak menyesuaikan dengan volume, jadi Anda langsung tahu:
- Kotak samar = minat ringan (perhatikan)
- Kotak kuat = minat berat (hormati)
Tidak ada indikator tambahan, tidak ada gimnastik interpretasi — ini benar-benar terlihat.
Zona Adaptif Volatilitas (Lebar ATR)
Pasar tidak bergerak sama setiap hari.
Indikator ini menyesuaikan ketebalan kotak menggunakan baseline ATR panjang, sehingga zona melebar atau menyempit sesuai volatilitas.
Hasilnya:
zona tetap realistis daripada terlalu tipis untuk penting atau terlalu lebar sehingga tidak berguna.
Intelijen Tahan vs Tembus (dan Umpan Balik Visual Instan)
Sebuah zona hanya berharga jika Anda bisa membaca apa yang dilakukan harga terhadapnya.
Indikator ini melacak:
- Tahanan (penolakan / penghormatan)
- Tembusan (penerimaan melalui zona)
…dan kemudian memperbarui gaya secara langsung:
- Tahanan mempertahankan “identitas dukungan/perlawanan” asli
- Tembusan membalik perilaku (dukungan bisa menjadi perlawanan dan sebaliknya)
- Gaya tembus bisa berubah menjadi garis putus-putus + nada warna baru sehingga Anda langsung tahu:
“Level ini baru saja berubah karakter.”
Berlian + Label Tembus: Pemicu keputusan yang bersih
Anda mendapatkan penanda acara sinyal tinggi yang sederhana:
- Berlian untuk menyoroti acara tahan/balik
- Label tembus sehingga Anda tidak pernah melewatkan saat level patah
Ini adalah perbedaan antara berpikir sesuatu tembus… dan mengetahui itu tembus.
Dibuat untuk Perdagangan Nyata: Kontrol + Grafik Bersih
Indikator ini dirancang agar tetap dapat digunakan setelah berjam-jam berdagang:
- Hanya ingin zona? Matikan berlian/label.
- Ingin sinyal murni? Matikan teks volume.
- Ingin kinerja? Batasi Maks Kotak.
- Benci kekacauan? Pembersihan Otomatis Acara menjaga grafik tetap tajam dengan menghapus tanda lama secara otomatis.
Anda tetap fokus pada pertempuran saat ini — tidak tenggelam dalam sejarah.
Pengaturan yang Direkomendasikan (Mulai Cepat)
✅ Periode Lookback: 20 (konfirmasi seimbang)
✅ Panjang Filter Vol: 2 (responsif)
✅ Mult Lebar Kotak: 1.0 (netral)
✅ Tampilkan Kotak: ON
✅ Berlian + Label Tembus: ON (sampai Anda mempelajari perilaku, lalu perbaiki)
✅ Pembersihan Otomatis Acara: ON (jaga tetap bersih)
Apa yang benar-benar diberikan indikator ini kepada Anda
Peta visual di mana pasar menunjukkan kartunya — dan pembacaan langsung apakah harga menghormati zona itu atau menghancurkannya.
Jika Anda berdagang tembusan, tarik kembali, pembalikan, atau uji ulang:
ini menjadi “lapisan medan perang” Anda.
Ringkasan
The indicator adapts box width based on average true range (ATR), ensuring zones scale with current market volatility. It continuously projects zones forward as price evolves, offering live updates on whether zones hold (support/resistance) or break (flip behavior). Visual markers such as diamonds and break labels signal hold and breakout events, enabling traders to quickly interpret market reactions without ambiguity.
Users can customize visual elements including boxes, volume text, event marks, and set limits on the number of boxes to maintain chart clarity and performance. An auto-clean system removes outdated event marks to prevent clutter. This tool supports trading across various markets including forex, indices, commodities, stocks, and cryptocurrencies, and is suitable for strategies involving breakouts, pullbacks, reversals, and retests.


