
Deskripsi
ZigzagSR – Ayunan Zigzag Dinamis dengan Dukungan & Resistensi Otomatis
Buka struktur pasar yang lebih jelas dan zona masuk yang tepat dengan ZigzagSR, indikator cTrader yang kuat yang:
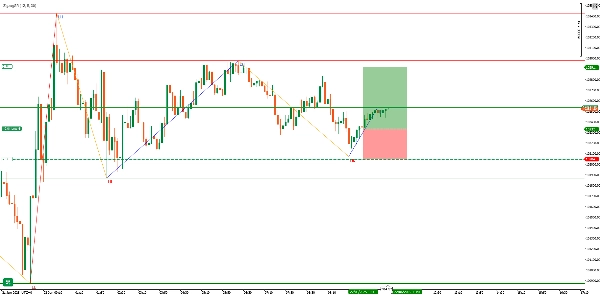
- Menggambar ayunan zigzag non-repainting (higher highs, lower highs, higher lows, lower lows) secara real time
- Secara otomatis menggambar level dukungan & resistensi dinamis berdasarkan ayunan pivot terbaru
- Memberi label pada setiap titik ayunan (“HH”, “LH”, “HL”, “LL”) untuk kejelasan tren sekilas
Fitur Utama
- Deteksi Zigzag Adaptif
-
- Parameter Depth, Deviation, dan Backstep yang dapat dikonfigurasi untuk menyetel sensitivitas terhadap noise pasar
- Logika non-repainting memastikan sinyal historis tetap stabil setelah digambar
- Level SR Otomatis
-
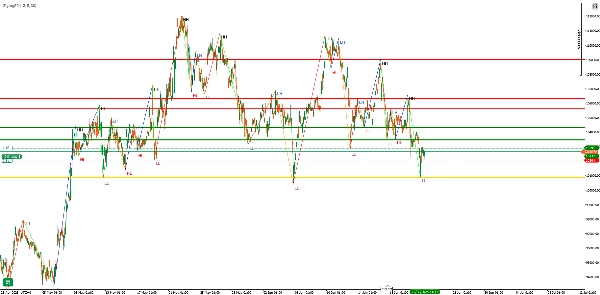
- Menggambar garis Pivot pada titik ayunan valid terakhir (garis emas)
- Menyoroti hingga tiga puncak Resistance terakhir (garis merah) dan tiga lembah Support (garis hijau) sebelum pivot
- Garis diperbarui secara mulus saat ayunan baru terbentuk, menjaga grafik Anda tetap rapi
- Label Visual yang Jelas
-
- “HH” (Higher High) dan “LH” (Lower High) untuk puncak bearish/lebih tinggi
- “HL” (Higher Low) dan “LL” (Lower Low) untuk lembah bullish/lebih rendah
- Segmen zigzag berwarna:
-
- HH → Lime
- LH → Orange
- HL → Blue
- LL → Red
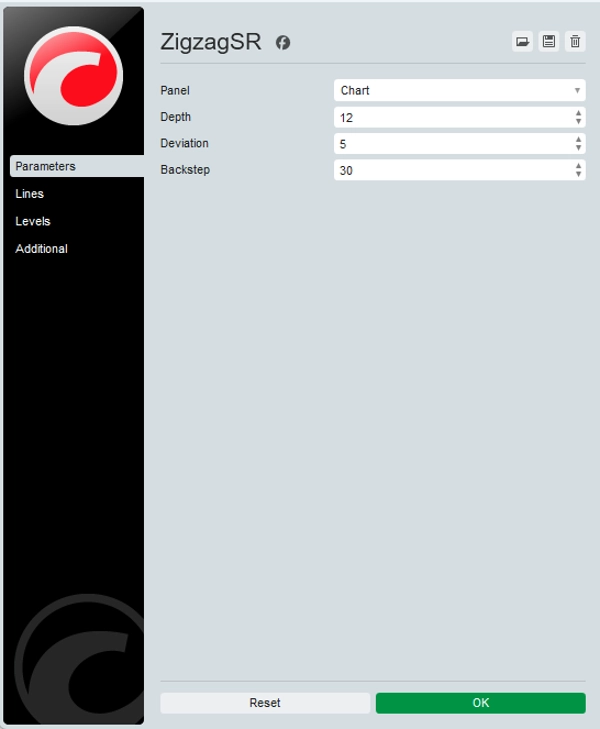
Input & Kustomisasi
ParameterDefaultDeskripsi
Depth
12
Jumlah bar mundur untuk mengidentifikasi puncak/lembah lokal
Deviation
5
Pergerakan harga minimum (dalam ticks) untuk dihitung sebagai ayunan
Backstep
3
Jumlah bar untuk “memundurkan” guna menekan pivot palsu
Tip: Tingkatkan Depth & Deviation pada timeframe yang lebih tinggi untuk menyaring noise; turunkan pada M1/M5 untuk sensitivitas.
Mengapa Menggunakan ZigzagSR?
- Konfirmasi Tren: Bedakan dengan jelas ayunan impulsif vs. gerakan korektif—ideal untuk trader swing dan breakout.
- Zona Masuk SR: Level yang ditandai otomatis membantu Anda menentukan zona masuk, stop-loss, dan take-profit tanpa menggambar garis secara manual.
- Pengembangan Strategi: Label dan garis langsung memberi masukan ke EA/cBots atau sistem manual—bangun setup berbasis aturan yang konsisten.
Cara Kerja
- Pemetaan High/Low
-
- Memindai bar selama
Depthperiode terakhir untuk menandai ekstrem lokal (_highMap&_lowMap).
- Memindai bar selama
- Konstruksi Ayunan
-
- Bergantian antara keadaan bullish dan bearish, hanya menambahkan pivot signifikan ke daftar ayunan.
- Penetapan Label
-
- Membandingkan setiap pivot dengan yang sebelumnya untuk memberi label sebagai HH/LH atau HL/LL.
- Penggambaran SR
-
- Mengidentifikasi pivot terbaru sebagai “garis pivot,” kemudian menggambar tiga puncak dan lembah valid sebelumnya sebagai resistance/support.
- Rendering Zigzag
-
- Menghubungkan semua titik ayunan dengan garis tren berwarna dan menampilkan label teks sedikit bergeser untuk kejelasan.
Kasus Penggunaan & Tips
- Swing Trading: Naikkan impuls multi-bar—masuk pada pullback ke garis pivot, target level SR berikutnya.
- Konfirmasi Breakout: Tunggu harga menembus garis resistance yang digambar oleh ZigzagSR, lalu konfirmasi dengan volume atau RSI.
- Overlay dengan Indikator Lain: Gabungkan dengan moving averages, divergensi RSI, atau profil volume untuk memperkuat sinyal.
Mulai dalam hitungan detik:
- Pasang ZigzagSR dari cTrader Store.
- Tarik ke grafik mana saja—tidak perlu pustaka eksternal.
- Sesuaikan tiga parameter input sesuai timeframe dan gaya strategi pilihan Anda.
Tingkatkan analisis grafik Anda dengan struktur ayunan real-time dan dukungan & resistensi dinamis—coba ZigzagSR hari ini!
Ringkasan
Ulasan pelanggan
5 | 33 % | |
4 | 67 % | |
3 | 0 % | |
2 | 0 % | |
1 | 0 % |


