

Deskripsi
🧠 Indikator RSI Lanjutan – Analisis Momentum Presisi
Dapatkan Wawasan Lebih Dalam tentang Tren Pasar dengan RSI yang Lebih Cerdas
The Advanced RSI Indicator adalah evolusi kuat dari alat RSI klasik, dikembangkan untuk trader yang menghargai presisi dan penyaringan sinyal yang cerdas. Dengan pemulusan algoritmik lanjutan, zona adaptif, dan deteksi divergensi terintegrasi, alat ini menyediakan analisis momentum yang halus untuk semua pasar dan kerangka waktu.
🔍 Fitur Utama:
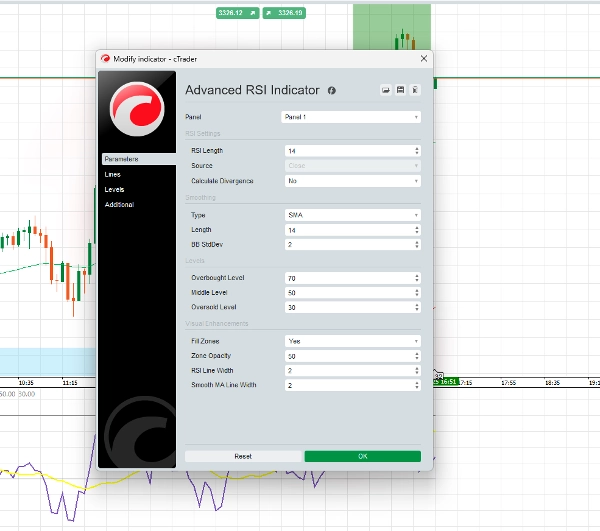
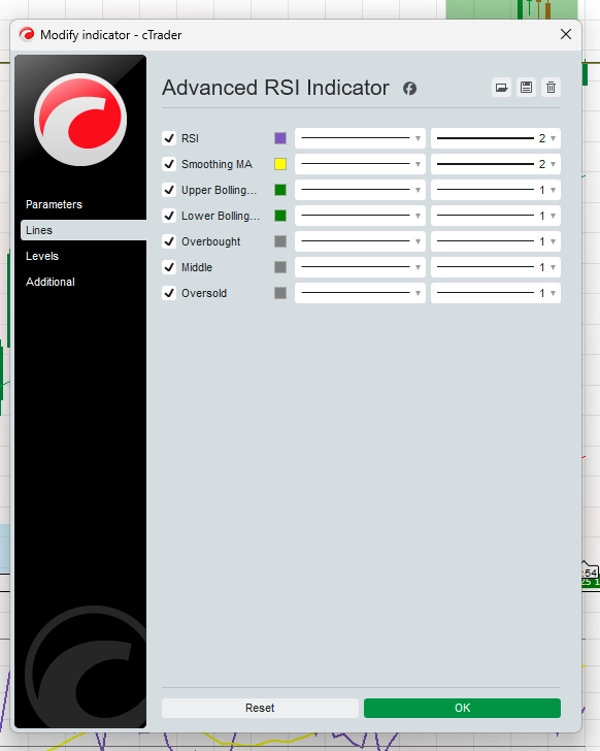
✅ Kurva RSI yang Diperhalus
Mengurangi pergerakan yang bergejolak dan sinyal palsu untuk wawasan yang lebih jelas tentang tren pasar.
✅ Zona Sinyal Adaptif
Melampaui level tradisional 70/30 dengan ambang dinamis yang merespons volatilitas pasar.
✅ Zona Momentum Berkode Warna
Menilai momentum bullish atau bearish dengan cepat melalui desain visual yang intuitif.
✅ Peringatan Divergensi
Menyoroti pengaturan divergensi bullish dan bearish untuk mendukung pengambilan keputusan strategis.
✅ Sistem Peringatan Kustom
Atur peringatan untuk penyeberangan level RSI dan sinyal divergensi agar Anda tidak pernah melewatkan momen penting.
✅ Multi-Aset, Multi-Kerangka Waktu
Dioptimalkan untuk digunakan di forex, kripto, saham, indeks, dan lainnya — dari grafik M1 hingga harian.
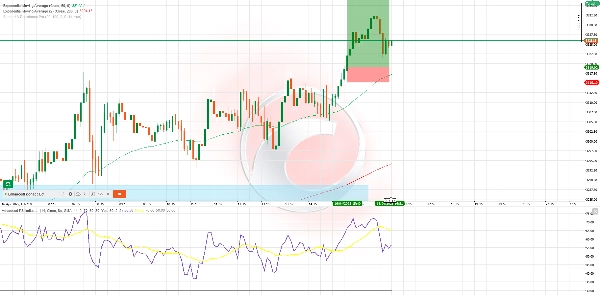
⚙️ Contoh Strategi – RSI Wave Ride
Terbaik untuk: perdagangan swing H1 & H4
Indikator yang digunakan: Advanced RSI, 50 EMA, 200 EMA
Contoh Beli:
- Harga berada di atas 50 & 200 EMA
- RSI turun di bawah 40 dan mulai naik
- Warna momentum bullish muncul
- (Opsional) Divergensi bullish terdeteksi
- Masuk: Penutupan candle di atas sinyal
- SL: Di bawah swing low terakhir
- TP: 1,5x–2x risiko atau resistance terbaru
Contoh Jual:
- Harga berada di bawah 50 & 200 EMA
- RSI bergerak di atas 60, lalu mulai menurun
- Warna momentum bearish mengonfirmasi arah
- (Opsional) Divergensi bearish menambah kekuatan
- Masuk: Penutupan candle konfirmasi
- SL: Di atas swing high terakhir
- TP: 1,5x–2x risiko atau support terbaru
💬 Mengapa Trader Memilih Alat Ini:
- Mudah digunakan, namun kuat
- Sinyal yang tidak repaint
- Telah diuji di pasar utama
- Dapat digunakan sendiri atau bersama strategi lain
Ringkasan
Ulasan pelanggan
5 | 100 % | |
4 | 0 % | |
3 | 0 % | |
2 | 0 % | |
1 | 0 % |


