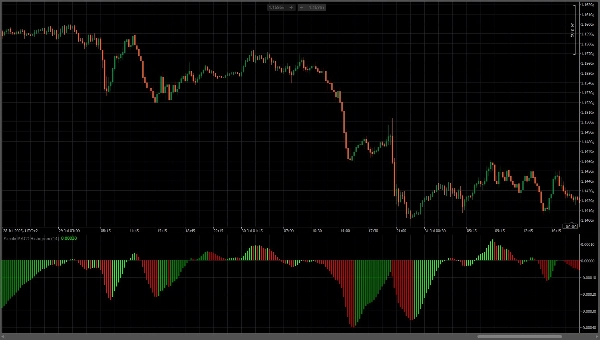
Logo "Simple MACD Histogram"
Simple MACD Histogram
Gambar unggahan "Simple MACD Histogram"
Sejak 15/06/2025
515
Instal gratis

This custom MACD Histogram indicator displays the MACD histogram with enhanced visual clarity styling. The indicator uses a fast EMA period of 14, automatically calculates the slow EMA as fast plus 2 (16). The indicator features highly contrasted color-coding for instant trend recognition: bright green bars indicate rising momentum (bullish), while red bars show falling momentum (bearish). The histogram bars extend symmetrically from a center zero line, creating an intuitive visual representation where green signals buy pressure and red signals sell pressure. This visualization style provides clear, unambiguous momentum signals and helps identify potential trend reversals and momentum shifts in price action.

Indicator profile
0.0
Ulasan: 0
Ulasan pelanggan
Belum ada ulasan untuk produk ini. Sudah mencobanya? Jadilah pemberi ulasan pertama!
Products available through cTrader Store, including trading bots, indicators and plugins, are provided by third-party developers and made available for informational and technical access purposes only. cTrader Store is not a broker and does not provide investment advice, personal recommendations or any guarantee of future performance.

Produk lain dari penulis ini

Flexible VWAP indicator with timezone-aware, custom time periods and automatic DST handling.

Anda mungkin juga suka

Fear & Greed Index: 4 configurable components (momentum, volatility, strength, pattern) with 6 calculation methods each
Overbought Oversold Indicator
Stochastic Momentum Index (SMI) for cTrader optional higher-timeframe source, and clear overbought/oversold levels.
Half Trend Cloud
Multi-timeframe ATR, smart swap calculator, range analysis all in one professional panel.
Volume distribution analysis with Market Profile TPO integration.
ZLEMA (Zero Lag EMA) is a faster, smoother version of EMA, ideal for capturing quick market shifts and trends.
Volume Profile plots traded volume at each price level, highlighting high activity zones of precise support & resistance
[Hamster-Coder] Pivot Points (Standard)
MacD Custom Indicator-Multiple Time Frame
Daily High & Low with live Percentage change.
don't move to the end of chart after timeframe changing. it should be better to use for near history. for long history
Intrinsic Recursive Value Indicator
DailyLossGuard is a simple and practical cTrader indicator that monitors your total daily P/L in real time. It combines
Multi Timeframe Trend Scanner 🔍 EMA+RSI+ATR heatmap with clear BUY/SELL bias from M5 up to D1.
Anchored VWAP Buttons
"Advanced VSA & CVD indicator with 'A+ Setup' filtering based on Support & Resistance levels."
Market Session Indicator
Sejak 15/06/2025
515
Instal gratis