
Deskripsi
🔍 Memeriksa data volume selama periode historis tertentu, menyoroti area potensial di mana investor dengan leverage tinggi mungkin menghadapi likuidasi, memberikan wawasan berharga tentang perilaku pasar.
Apa fungsi indikator ini?
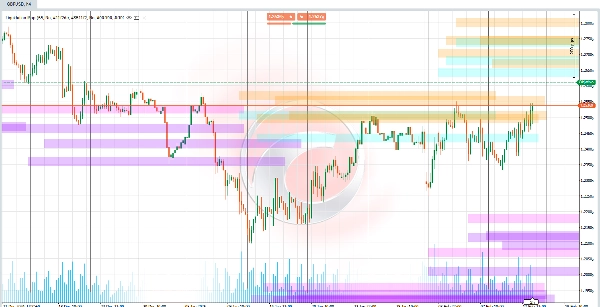
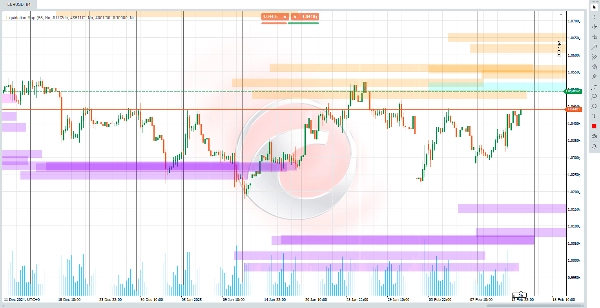
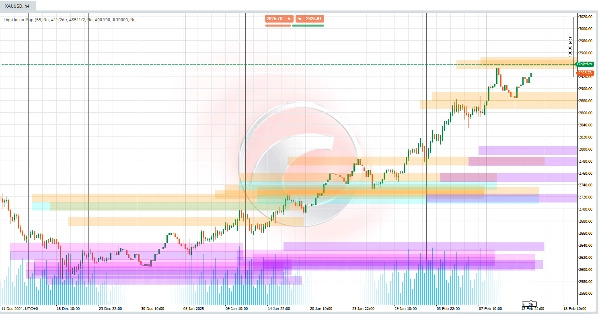
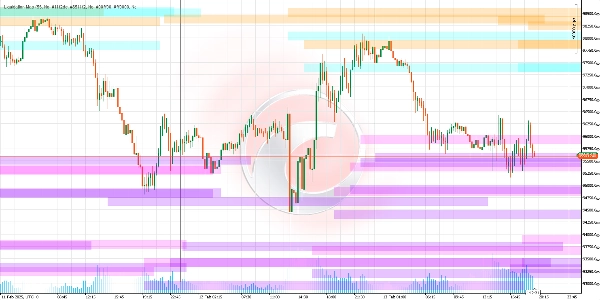
Algoritma ini mengidentifikasi level harga di mana likuidasi besar-besaran posisi leverage (seperti 5x, 10x, 25x, 50x, atau 100x) kemungkinan besar terjadi. Level-level ini berfungsi sebagai "magnet" untuk pergerakan harga, karena likuidasi dapat memicu ayunan pasar yang tajam. Indikator ini menggambar garis horizontal pada grafik, mewakili ambang batas ini dan memproyeksikannya ke masa depan untuk mengantisipasi zona-zona kunci yang menarik.
Bagaimana level-level ini dihitung?
- Deteksi Pivot Harga:
🔄 Ini mengidentifikasi titik tertinggi dan terendah terbaru di grafik (titik di mana harga berubah arah). Pivot ini menjadi dasar untuk menghitung level likuidasi. - Volume sebagai Pemicu:
📊 Membandingkan volume saat ini dengan rata-rata historis. Jika volume melebihi ambang tertentu (misalnya, 1,2x rata-rata untuk 100x), maka level likuidasi yang sesuai diaktifkan. - Formula Likuidasi:
Semakin tinggi leverage, semakin dekat level likuidasi dengan harga saat ini. -
- Untuk posisi long: Level likuidasi ditetapkan di bawah pivot rendah, dihitung berdasarkan leverage (misalnya, 2% di bawah untuk 50x).
- Untuk posisi short: Level ditetapkan di atas pivot tinggi, menggunakan prinsip yang sama.
Apa yang bisa Anda harapkan saat menggunakannya?
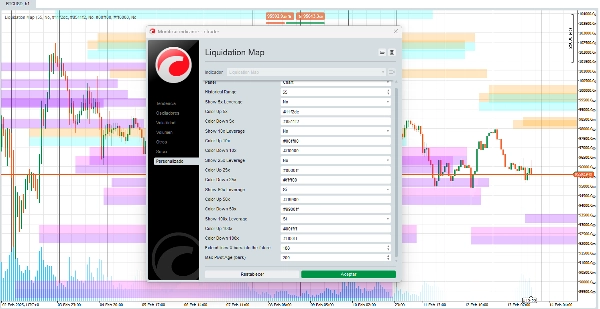
- Garis Likuiditas: 🎨 Anda akan melihat garis horizontal yang dapat disesuaikan yang mewakili zona di mana pasar mungkin mengalami volatilitas tinggi akibat likuidasi.
- Leverage yang Dapat Dikustomisasi: ⚙️ Anda dapat mengaktifkan/nonaktifkan level untuk setiap jenis leverage (misalnya, fokus hanya pada 50x dan 100x).
- Kustomisasi Warna: 🌈 Anda dapat memilih warna untuk setiap rentang likuidasi, menyesuaikan visualisasi sesuai preferensi Anda.
- Zona Kemacetan: 🎯 Beberapa garis yang berdekatan menunjukkan area risiko tinggi/imbalan tinggi di mana beberapa likuidasi dapat terjadi secara bersamaan.
Bagaimana cara menginterpretasikan sinyalnya?
- Harga Mendekati Garis: 🚨 Jika harga mendekati level likuidasi (terutama dengan volume tinggi), kemungkinan pergerakan tajam meningkat.
- Warna dan Transparansi: 🎨 Warna bervariasi berdasarkan leverage (misalnya, biru untuk 25x, oranye untuk 50x). Transparansi menunjukkan "kekuatan" volume terkait (garis lebih gelap = volume lebih signifikan).
Mengapa ini berguna?
- Peramalan Proaktif: 🔮 Ini tidak hanya menganalisis masa lalu; juga memproyeksikan level masa depan berdasarkan kondisi saat ini.
- Fokus Psikologi Pasar: 🧠 Likuidasi paksa sering menciptakan reaksi berantai (misalnya, order stop-loss memicu lebih banyak penjualan). Indikator ini membantu Anda mengantisipasinya.
- Kustomisasi: 🛠️ Sesuaikan visualisasi dengan strategi Anda (misalnya, prioritaskan leverage lebih tinggi di pasar yang volatil).
Keterbatasan yang perlu dipertimbangkan
- Ketergantungan pada Volume: 📉 Jika volume rendah atau data historis tidak memadai, sinyal mungkin kurang dapat diandalkan.
- Bukan Bola Kristal: 🔮 Level menunjukkan zona kemungkinan, bukan kepastian. Selalu kombinasikan dengan analisis lain.
- Lingkungan Dinamis: 🌍 Di pasar dengan berita tak terduga, likuidasi dapat terjadi di luar level yang diproyeksikan.
Indikator Ctrader Store:
Dynamic Market Structure
Analysis of Turning Points
Fibonacci Linear
Regression Multi-timeframe
Multi-Level Candle Bias
Tracker
Auto Support and
Resistance Trend Lines
Ringkasan
Ulasan pelanggan
5 | 67 % | |
4 | 0 % | |
3 | 33 % | |
2 | 0 % | |
1 | 0 % |


![Logo "[Stellar Strategies] Smart ADX"](https://cdn.ctrader.com/image/webp/af13b084-b6f6-41db-b7bc-c7e688b57b05_36929)


