
Deskripsi
🚀 Lebih dari 10.000 trader sudah menggunakan indikator TOP kami🏆
Temukan mengapa para profesional memilih kami – alat paling kuat di cTrader (indikator, algoritma, dan cBots) menunggu Anda.
👉 Dapatkan semua sistem TOP kami di sini:
_______________________________________________
📌 Indikator Struktur Pasar
· ✅ AdvancedMarket Structure: Bos, Choch, SwinLevels, Order Blocks, Market Structure& Liquidity Finder
· 🔄 Dynamic Market StructureAnalysis of Turning Points
· 🧱 Order Block
· ⚖️ Market Imbalance
· ⛓️ BOS & CHOCH
· 🧠 ICT Power of 3
_______________________________________________
🔚 Sistem Keluar Pintar
_______________________________________________
📐 Indikator ZigZag
· 🔍 Proyeksi Likuiditas Harga ZigZag
· ➖ ZigZag
· 🎯 Pelacak Ekstremitas Zig-Zag
_______________________________________________
🧱 Indikator Support & Resistance
· 🟩 Garis Support & Resistance SmartTrend
· 🧱 Semua Level Support dan Resistance
_______________________________________________
📊 Indikator Tren & Saluran
· 📊 Supertrend
· 🔁 Rata-Rata Bergerak Reaktif
_______________________________________________
💧 Alat Volume & Likuiditas
· 🔍 Celah Nilai Wajar Momentum
_______________________________________________
⚡ Indikator Momentum & RSI
· 📈 Pemicu Tren RSI
· 🔎 Bias Lilin Multi-Level
Pelacak
_______________________________________________
🔮 Alat Prediksi & Proyeksi
· 📐 Prediksi Berdasarkan Linreg& ATR
· 📏 Regresi Linear FibonacciMulti-timeframe
· 📈 Proyektor Aliran Pasar Berbasis Volume
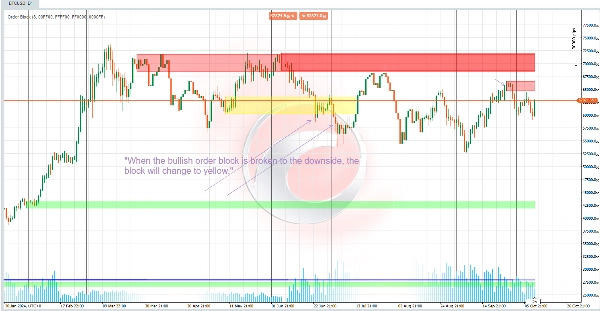
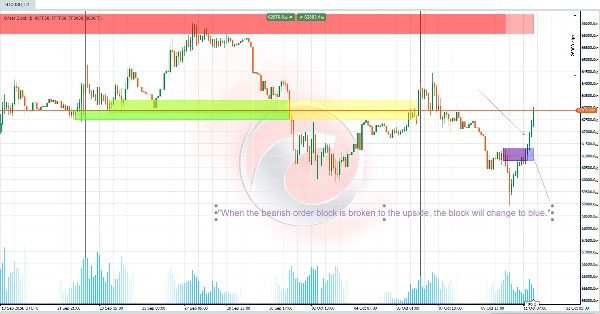
🟢 Mengidentifikasi Order Blocks 🔴
**Order Block Bullish 🚀:**
Untuk menemukan order block bullish:
- Kode memeriksa apakah harga penutupan saat ini melewati titik tertinggi dari ayunan sebelumnya ⬆️.
- Jika iya dan ayunan tersebut belum dilintasi, maka ditandai sebagai telah dilintasi. Order block kemudian didefinisikan dari harga terendah hingga tertinggi pada candle sebelumnya 📈.
**Order Block Bearish 🔻:**
- Ini bekerja serupa tetapi diterapkan pada ayunan harga rendah.
- Order block bearish dibuat ketika harga penutupan saat ini jatuh di bawah titik terendah dari sebuah ayunan ⬇️.
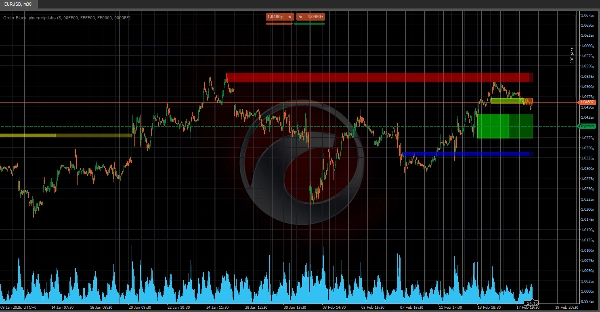
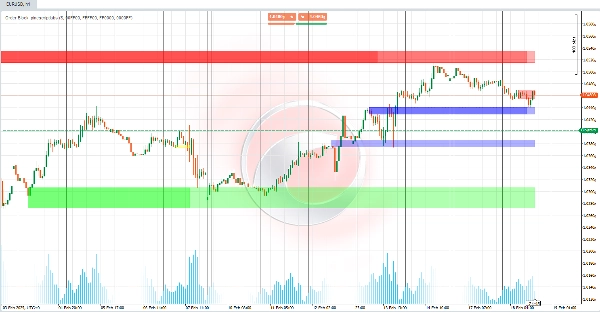
### 💼 Fungsi Order Block 📊
Order Blocks mewakili **zona akumulasi volume tinggi** di mana pemain pasar besar mungkin telah melakukan perdagangan secara signifikan
Area ini sering berfungsi sebagai level support atau resistance potensial dan dapat menandakan kelanjutan atau pembalikan tren 📉📈.
- **Support atau Resistance:** Order block yang ditembus mungkin menunjukkan area support atau resistance yang relevan, tergantung pada tren sebelumnya 🔄.
- **Kelanjutan atau Pembalikan:**
- Terobosan order block ke arah berlawanan dapat mengindikasikan potensi pembalikan 🔄.
- Terobosan ke arah yang sama dapat mengonfirmasi kelanjutan tren 🔗.
Indikator ini sangat kuat untuk mengidentifikasi **level kunci pada grafik** 📈, membantu trader memvisualisasikan area penting berdasarkan perilaku harga di zona volume tinggi. Sempurna untuk mengenali tren dan pergerakan pasar! 🎯📊
Ringkasan
Ulasan pelanggan
5 | 100 % | |
4 | 0 % | |
3 | 0 % | |
2 | 0 % | |
1 | 0 % |


