Deskripsi
Index Hunter: Ikhtisar
Index Hunter adalah indikator teknis khusus dan sistem pendukung keputusan yang dirancang terutama untuk indeks volatilitas tinggi seperti US30 (Dow Jones) dan NAS100 (Nasdaq). Berbeda dengan indikator standar yang hanya menampilkan data masa lalu, Index Hunter fokus pada "Prediksi Vektor"—mencoba memproyeksikan di mana harga kemungkinan akan berada 4 candle ke depan berdasarkan kecepatan saat ini (kemiringan) di berbagai kerangka waktu.
1. Mekanisme Inti (Cara Kerja)
A. Mesin Peramalan "Vektor"
Ini adalah inti dari alat ini. Ia tidak hanya melihat harga saat ini; ia menghitung laju perubahan (Kemiringan) di kerangka waktu M5, M15, dan H1 untuk menggambar "Jalur Masa Depan" pada grafik Anda.
- Mekanisme: Ia menghitung rata-rata tertimbang momentum dari berbagai kerangka waktu untuk memproyeksikan 4 titik (P1, P2, P3, P4) ke masa depan.
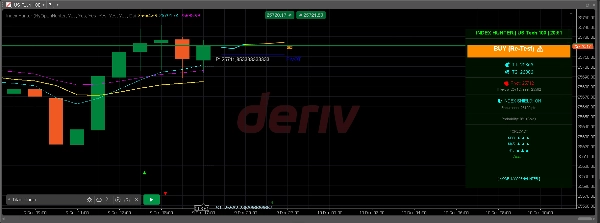
- Visual: Anda melihat jalur berwarna (Sian -> Kuning -> Oranye) yang memanjang ke kanan harga, memvisualisasikan inersia pasar.
- Jalur Hantu: Ia juga mengingat prediksi sebelumnya (Jalur Hantu) sehingga Anda dapat melihat apakah pasar menghormati proyeksi algoritma sebelumnya (sebuah "cek realitas").
B. Sistem Visual Multi-Lapisan
Ia menampilkan level institusional penting secara otomatis:
- Pivot Points (Fleksibel): Menghitung secara otomatis level Pivot, R1/S1, dan R2/S2 berdasarkan kerangka waktu yang dapat dipilih (H12, Harian, Hari2, atau Hari3).
- Level Psikologis: Menggambar "Garis Psikologis" pada setiap interval 100 poin (misalnya, 34000, 34100), yang sering bertindak sebagai zona magnet untuk indeks.
- Tinggi/Rendah Harian: Menandai rentang hari sebelumnya untuk menunjukkan zona breakout atau penolakan.
- Fraktal: Mengidentifikasi puncak dan dasar lokal dengan panah (▲ ▼) untuk penempatan entry/stop-loss yang tepat.
C. Logika "Kepercayaan" & Kelayakan
Alat ini tidak hanya memberikan sinyal; ia menilai sinyal tersebut.
- Perhitungan: Ia mengukur jarak ke target keuntungan Anda dan membandingkannya dengan energi pasar saat ini (ATR - Average True Range).
- Output:
-
- PANAS (>80%): Momentum kuat + Jarak target yang wajar.
- HANGAT (50-80%): Setup sedang.
- DINGIN (<50%): Pasar menganggap probabilitas mencapai target rendah (misalnya, target terlalu jauh untuk volatilitas saat ini).
D. Mekanisme "Perisai" Akun
Ini termasuk manajer risiko pasif pada panel:
- Metrik Ketahanan: Menghitung berapa banyak "poin" pasar dapat bergerak melawan Anda sebelum akun Anda dalam bahaya, berdasarkan saldo dan ukuran lot minimum Anda.
- Status: Menampilkan "🛡️ PERISAI INDEKS: AKTIF" jika akun Anda aman relatif terhadap volatilitas saat ini (ATR), atau "⚠️ MARGIN RENDAH" jika volatilitas terlalu tinggi untuk saldo Anda.
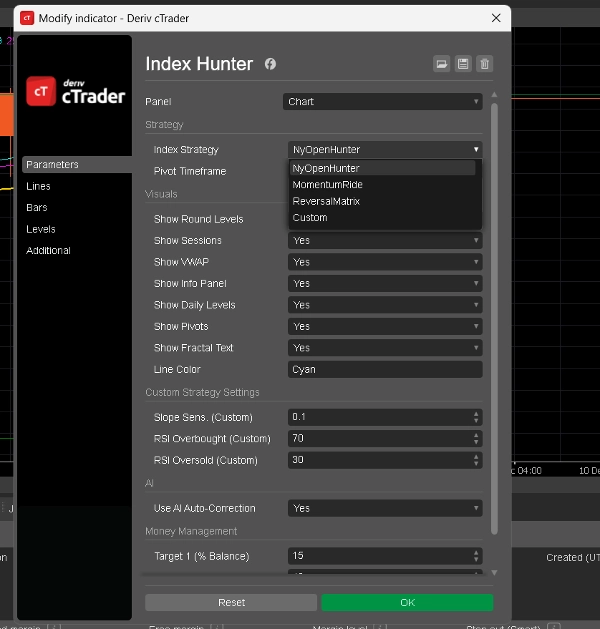
2. Mode Tersedia (Strategi)
Anda dapat beralih antara mode ini di pengaturan indikator (
Strategi Indeks
parameter). Setiap mode mengubah cara AI menafsirkan pasar.
1. Mode: NyOpenHunter (Scalper New York)
- Terbaik Untuk: 2-3 jam pertama yang kacau dari Pembukaan Pasar AS.
- Logika:
-
- Waktu Aktif: 13:00 - 17:00 UTC (perkiraan).
- Pemicu: Mencari Kemiringan M5 lebih besar dari 0.1 (atau kurang dari -0.1).
- Filosofi: "Tangkap ledakan." Ia menunggu ledakan volume awal di bel NY dan memberi sinyal untuk mengikuti gelombang tersebut.
- Sentimen Panel: Menampilkan "NY OPEN BUY 🚀" atau "NY OPEN SELL 🔻".
2. Mode: MomentumRide (Pengikut Tren)
- Terbaik Untuk: Tren kuat dan berkelanjutan di luar pembukaan.
- Logika:
-
- Pemicu: Memerlukan Kemiringan M5 yang lebih kuat (> 0.2) dibanding mode NY.
- Filosofi: "Jangan terpotong." Ia mengabaikan pergerakan lemah dan hanya memberi sinyal saat pasar bergerak dengan keyakinan signifikan.
- Sentimen Panel: Menampilkan "MOMENTUM UP 🟢" atau "MOMENTUM DOWN 🔴".
3. Mode: ReversalMatrix (Lawan Tren)
- Terbaik Untuk: Pasar yang bergerak sideways atau menangkap puncak/dasar.
- Logika:
-
- Pemicu: Menggunakan RSI (Relative Strength Index).
-
- Sinyal Jual: RSI > 75 (Jenuh Beli).
- Sinyal Beli: RSI < 25 (Jenuh Jual).
- Filosofi: "Lawan ekstrem." Ia mengidentifikasi saat karet terlalu meregang dan kemungkinan akan kembali ke posisi semula.
- Sentimen Panel: "JENUH BELI (SEGERA JUAL)" atau "JENUH JUAL (SEGERA BELI)".
4. Mode: Kustom (Ditetapkan Pengguna)
- Terbaik Untuk: Pengguna tingkat lanjut yang ingin menyetel bot.
- Logika: Memungkinkan Anda mengatur ambang batas sendiri untuk Sensitivitas Kemiringan dan level RSI di pengaturan.
-
- Contoh: Anda dapat membuat strategi hibrida yang hanya membeli jika Kemiringan > 0.05 DAN RSI < 40.
3. "Panel Info" (Tampilan Heads-Up)
Panel visual di sisi kanan grafik mengkonsolidasikan semua data ini:
- Header: Menampilkan mode dan simbol saat ini.
- Preferensi: Bias utama AI (misalnya, "BELI 34150 ▲").
- Target (T1, T2): Target keuntungan dinamis yang dihitung berdasarkan pengaturan persentase akun dan volatilitas Anda.
- Peramalan: Analisis berurutan tren M30, M45, dan H1 (misalnya, "M30: ▲ ▲ ▲" berarti keselarasan beli kuat).
- Probabilitas: Skor kepercayaan AI (Panas/Hangat/Dingin).
Ringkasan
Key features include an automatic overlay of institutional levels such as pivot points (with selectable timeframes), psychological price levels at 100-point intervals, previous day’s high/low, and fractals marking local tops and bottoms. It incorporates a confidence grading system (Hot, Warm, Cold) based on momentum strength and volatility relative to profit target distance.
Index Hunter includes a risk management "Shield" that assesses account safety by calculating potential adverse market moves against account balance and lot size, displaying status alerts accordingly.
The indicator offers four operational modes: NyOpenHunter (New York market open scalping), MomentumRide (trend following), ReversalMatrix (counter-trend using RSI), and a Custom mode for user-defined slope and RSI thresholds. A comprehensive info panel consolidates mode, bias, dynamic targets, trend forecasts, and confidence scores for decision support.
Ulasan pelanggan
5 | 67 % | |
4 | 33 % | |
3 | 0 % | |
2 | 0 % | |
1 | 0 % |