
Deskripsi
Supertrend Channels adalah indikator overlay khusus yang dirancang untuk membantu trader mengidentifikasi secara visual zona support dan resistance dinamis, sinyal masuk, dan level trailing stop-loss menggunakan logika berbasis ATR.
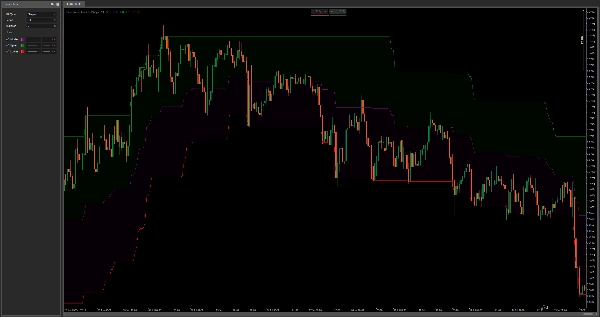
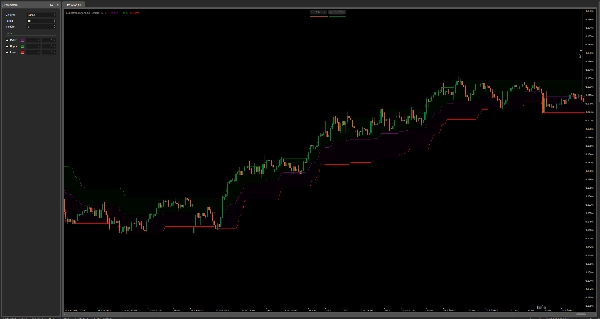
Indikator ini menggambar tiga garis:
- Upper Band (Hijau) – berfungsi sebagai resistance dinamis atau trailing stop-loss untuk perdagangan long.
- Lower Band (Merah) – berfungsi sebagai support dinamis atau trailing stop-loss untuk perdagangan short.
- Middle Line (Ungu) – berfungsi sebagai level mean-reversion atau titik masuk potensial.
Indikator ini menghitung band menggunakan Average True Range (ATR) yang dikalikan dengan faktor yang ditentukan pengguna (Multiplier) dan menambahkan/mengurangkan nilai tersebut dari harga tertinggi/terendah candle saat ini. Metode perataan (jenis MA yang dapat dipilih) diterapkan pada ATR untuk menyesuaikan responsivitas.
Cara Menggunakan:
- Entry: Cari titik masuk di dekat middle line selama konsolidasi atau setelah sinyal crossing.
- Trailing Stop-Loss: Gunakan upper/lower bands sebagai zona keluar dinamis untuk mengamankan keuntungan saat tren berlanjut.
- Support & Resistance: Band ini berfungsi sebagai zona adaptif yang mencerminkan volatilitas terbaru dan membantu mengidentifikasi potensi titik balik.
Berbeda dengan Bollinger Bands standar, pendekatan ini mengaitkan band pada ekstrem harga plus volatilitas, bukan rata-rata bergerak, sehingga lebih responsif dalam lingkungan tren dan lebih adaptif untuk trading diskresioner atau algoritmik.
Ringkasan
Ulasan pelanggan
5 | 50 % | |
4 | 50 % | |
3 | 0 % | |
2 | 0 % | |
1 | 0 % |


