
HTFBB
Индикатор
1 покупки
Версия 1.0, Jul 2025
Windows, Mac
5.0
Отзывы: 1
Описание
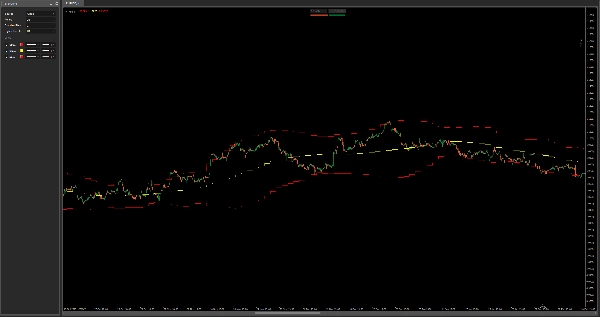
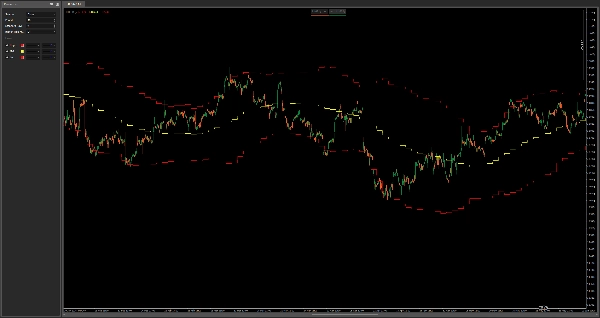
HTF Полосы Боллинджера – Мультивременная карта волатильности
Этот индикатор отображает Полосы Боллинджера с более высокого таймфрейма на вашем текущем графике, предоставляя мощный контекст для волатильности, возврата к среднему и динамической поддержки/сопротивления — всё это без переключения таймфреймов.
Особенности:
- Отображает верхние, средние и нижние полосы Боллинджера с любого выбранного более высокого таймфрейма
- Отлично подходит для выявления зон консолидации HTF, давления прорыва и откатов тренда
- Идеально для скальпинга и внутридневных входов с учётом более высокого таймфрейма
- Работает со всеми активами и таймфреймами
Комбинируйте с вашей текущей стратегией, чтобы избегать торговли в ловушках волатильности и оставаться в согласии с макроценовой структурой.
Сводка
Профиль индикатора
Отзывы покупателей
5.0
Отзывы: 1
5 | 100 % | |
4 | 0 % | |
3 | 0 % | |
2 | 0 % | |
1 | 0 % |
Отзывы покупателей
July 29, 2025
confusing signals get easier to ignore, but a clean signal can still fail.
Обсуждение
Частые вопросы
Продукты, доступные в cTrader Store, включая торговых ботов, индикаторы и плагины, предоставляются сторонними разработчиками и доступны исключительно в информационных и технических целях. cTrader Store не является брокером и не предоставляет инвестиционные консультации, персональные рекомендации или какие-либо гарантии будущей доходности.


Цена
С 03/01/2025
638.03K
Торгуемый объем
21.34K
Выигранные пипы
15
Продажи