
Описание
Supertrend Channels — это пользовательский индикатор наложения, разработанный для помощи трейдерам в визуальном определении динамических зон поддержки и сопротивления, сигналов входа и уровней трейлинг-стопа с использованием логики на основе ATR.
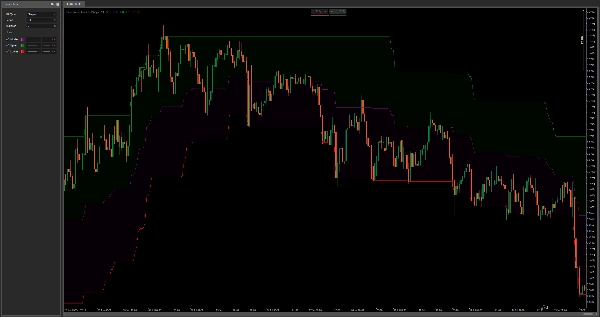
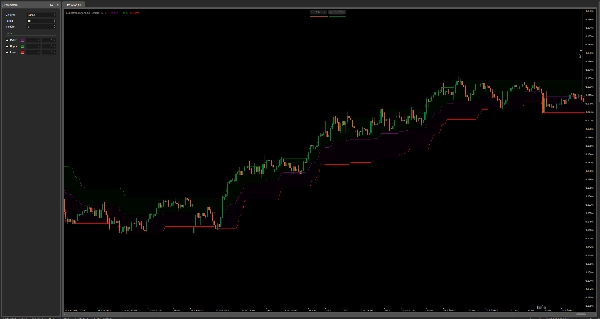
Индикатор отображает три линии:
- Верхняя граница (зеленая) — служит динамическим уровнем сопротивления или трейлинг-стопом для длинных позиций.
- Нижняя граница (красная) — служит динамическим уровнем поддержки или трейлинг-стопом для коротких позиций.
- Средняя линия (фиолетовая) — выступает уровнем возврата к среднему или потенциальной точкой входа.
Расчет границ основан на Average True Range (ATR), умноженном на заданный пользователем коэффициент (Multiplier), который добавляется или вычитается из максимума/минимума текущей свечи. Для ATR применяется метод сглаживания (выбираемый тип скользящей средней) для настройки чувствительности.
Как использовать:
- Вход: Ищите точки входа около средней линии во время консолидаций или после сигналов пересечения.
- Трейлинг-стоп: Используйте верхние/нижние границы как динамические зоны выхода для фиксации прибыли по мере продолжения тренда.
- Поддержка и сопротивление: Эти границы выступают как адаптивные зоны, отражающие недавнюю волатильность и помогающие выявлять потенциальные точки разворота.
В отличие от стандартных полос Боллинджера, этот подход основывает границы на экстремумах цены и волатильности, а не на скользящей средней, что делает его более чувствительным в трендовых условиях и более адаптивным для дискреционной или алгоритмической торговли.
Сводка
Отзывы покупателей
5 | 50 % | |
4 | 50 % | |
3 | 0 % | |
2 | 0 % | |
1 | 0 % |


