

SwingHighLow
Индикатор
13 покупки
Версия 1.0, Jul 2025
Windows, Mac
4.3
Отзывы: 3
С 03/01/2025
638.03K
Торгуемый объем
21.34K
Выигранные пипы
19
Продажи
Описание
Индикатор Swing High/Low для cTrader
Картируйте структуру рынка как профессионал.
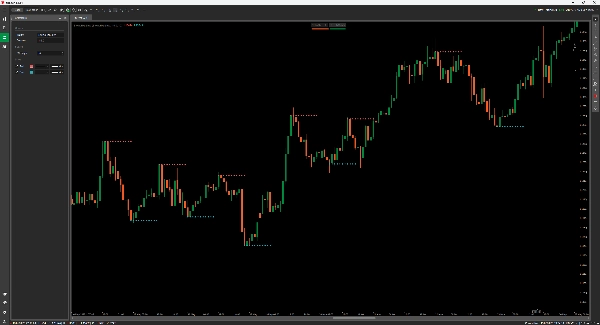
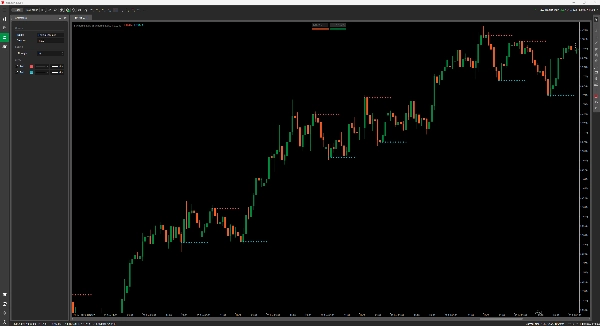
Этот индикатор Swing High/Low автоматически обнаруживает и отображает значимые поворотные точки на вашем графике — идеально подходит для трейдеров, которые опираются на ценовое действие, структуру и зоны поддержки/сопротивления.
Особенности:
- Выделяет подтверждённые Swing High (красные) и Swing Low (синие) с чёткими точечными отметками.
- Регулируемый параметр Strength позволяет фильтровать шум или ужесточать сигналы.
- Идеально подходит для анализа тренда, выявления разворотов и ловушек пробоя.
Работает на всех таймфреймах. Без перерисовки. Просто чёткая структура рынка, ясно обозначенная.
Сводка
AI summary
The SwingHighLow indicator for cTrader automatically detects and plots significant swing highs and lows on price charts, aiding traders in identifying market structure, price reversals, and support/resistance zones. It highlights confirmed swing highs in red and swing lows in blue with clear point markers. The indicator includes an adjustable strength parameter that allows users to filter market noise or tighten signal sensitivity according to their trading preferences. It is suitable for use across all timeframes and supports analysis for various markets including Forex, indices, commodities, stocks, and cryptocurrencies such as BTCUSD, EURUSD, and XAUUSD. The tool is designed to assist with trend analysis, spotting reversals, and identifying breakout traps without repainting, providing consistent and reliable market structure visualization.
Профиль индикатора
Отзывы покупателей
4.3
Отзывы: 3
5 | 67 % | |
4 | 0 % | |
3 | 33 % | |
2 | 0 % | |
1 | 0 % |
Отзывы покупателей
July 22, 2025
Good support for rules for swing point analysis. it helps identify turning points and cleaner structure, especially when used for reviewing reversals, pullbacks and swing zones. Swing points look better after 3 pivots, especially when the 0.5 Fib area agrees with structure. The level is useful when it supports the market story.
July 21, 2025
July 21, 2025
Practical choice for demo for a more controlled workflow. It helps with reviewing reversals, pullbacks and swing zones, but the signal still needs broader context. Swing points look better after 3 pivots, especially when the 0.5 Fib area agrees with structure. I would still keep manual review in the process.
Обсуждение
Частые вопросы
BTCUSD
Forex
Signal
Breakout
Indices
EURUSD
Supertrend
Commodities
Stocks
XAUUSD
ATR
Продукты, доступные в cTrader Store, включая торговых ботов, индикаторы и плагины, предоставляются сторонними разработчиками и доступны исключительно в информационных и технических целях. cTrader Store не является брокером и не предоставляет инвестиционные консультации, персональные рекомендации или какие-либо гарантии будущей доходности.
















![Логотип продукта "[Stellar Strategies] Smart ADX"](https://cdn.ctrader.com/image/webp/af13b084-b6f6-41db-b7bc-c7e688b57b05_36929)








Цена
С 03/01/2025
638.03K
Торгуемый объем
21.34K
Выигранные пипы
19
Продажи