
VixFix
Indikator
Versi 1.0, Jul 2025
Windows, Mac
4.0
Ulasan: 1
Indikator VixFix untuk cTrader
Tangkap Kepanikan Pasar Sebelum Berita Muncul.
Indikator VixFix ini adalah adaptasi cerdas dari konsep klasik “VIX Fix” karya Larry Williams—dirancang untuk membantu trader mendeteksi ketakutan jangka pendek dan lonjakan volatilitas, sangat berguna dalam mengidentifikasi potensi dasar pasar.
Cara Kerjanya
- Menghitung lonjakan pseudo-volatilitas dengan membandingkan harga terendah terbaru dengan harga tertinggi selama periode yang dapat dikonfigurasi (default: 12).
- Menerapkan rata-rata bergerak dan envelope deviasi standar untuk memisahkan lonjakan sinyal dari kebisingan normal.
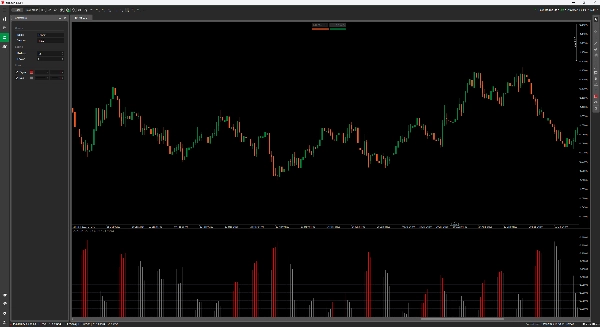
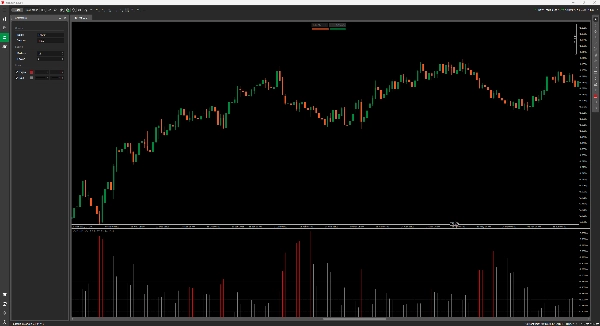
- Menampilkan batang histogram merah saat volatilitas melebihi ambang batas—tanda Anda untuk mulai memperhatikan.
Fitur
- Tampilan histogram bersih (tanpa overlay)
- Plot dua warna:
-
- Merah = Sinyal (lonjakan volatilitas di atas ambang batas)
- Abu-abu = Aktivitas normal
- Periode yang dapat disesuaikan dan faktor sensitivitas
- Tanpa lag indikator—menggunakan hanya aksi harga mentah, tanpa repainting
Kasus Penggunaan
- Mendeteksi potensi pembalikan dalam tren turun
- Waktu untuk perdagangan mean-reversion
- Mengonfirmasi kondisi oversold tanpa mengandalkan RSI atau alat lain yang lambat
Profil indikator
4.0
Ulasan: 1
5 | 0 % | |
4 | 100 % | |
3 | 0 % | |
2 | 0 % | |
1 | 0 % |
Produk-produk yang tersedia melalui cTrader Store, termasuk bot trading, indikator, dan plugin, disediakan oleh pengembang pihak ketiga serta hanya ditujukan untuk akses teknis dan informasi. cTrader Store bukan broker dan tidak menyediakan saran investasi, rekomendasi pribadi, atau jaminan apa pun tentang kinerja di masa mendatang.


Sejak 03/01/2025
638.03K
Volume trading
21.34K
Pip dimenangkan
15
Penjualan