
Candles_Painter
Индикатор
3 покупки
Версия 1.0, Aug 2025
Windows, Mac
5.0
Отзывы: 2
С 26/05/2025
449.3M
Торгуемый объем
61.1K
Выигранные пипы
15
Продажи
1.43K
Бесплатные установки
Описание
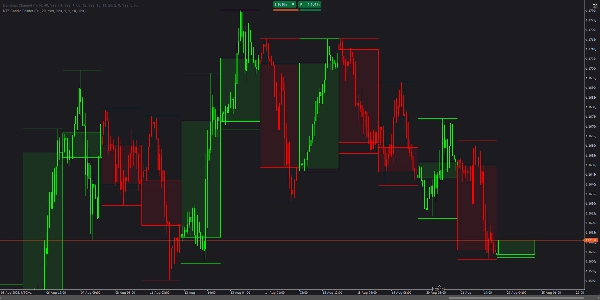
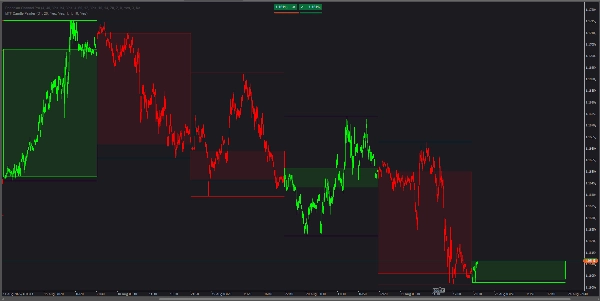
MTF Candle Painter накладывает контекст старшего таймфрейма (HTF) непосредственно на ваш текущий график. Он окрашивает каждый бар на активном таймфрейме в соответствии с направлением охватывающей свечи HTF и рисует заполненный прямоугольник тела HTF (только открытие–закрытие, без теней) плюс опциональные линии High/Low HTF. Отдельные цвета для быков и медведей и регулируемая непрозрачность заливки обеспечивают чистое, легко читаемое смещение с первого взгляда.
Основные характеристики
- Многофреймовое окрашивание баров: все бары внутри свечи HTF наследуют её бычий/медвежий цвет.
- Наложение тела HTF: прямоугольник между открытием и закрытием HTF; без средней тени для ясности.
- Отдельное оформление для быков и медведей: независимые цвета контура и заливки для бычьих и медвежьих свечей HTF.
- Регулируемая непрозрачность: настройка прозрачности заливки (по умолчанию 10%) для аккуратного наложения с ценой.
- Линии High/Low HTF: опционально, с настраиваемой толщиной.
- Контроль истории: выбор количества последних свечей HTF для отображения (по умолчанию 20).
- Лёгкий вес: использует нативные объекты графика; быстро и незаметно.
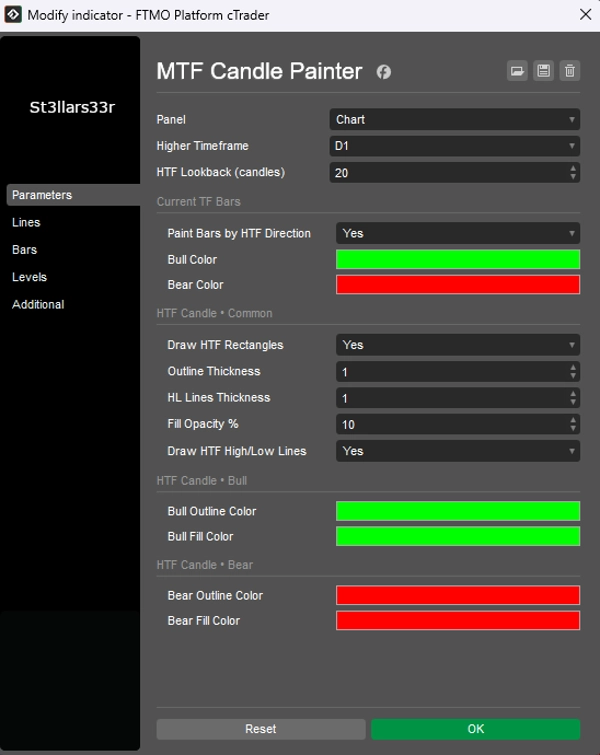
Параметры
Основные
Higher Timeframe– HTF для наложения (например, D1, H4, W1).HTF Lookback (candles)– сколько свечей HTF рисовать (по умолчанию 20).
Бары текущего таймфрейма
Paint Bars by HTF Direction– окрашивать бары текущего таймфрейма по направлению охватывающей свечи HTF (Да/Нет).Bull Color/Bear Color– цвета для баров текущего таймфрейма.
Свеча HTF • Общие
Draw HTF Rectangles– показывать прямоугольники тела HTF (по умолчанию Да).Outline Thickness– толщина контура тела HTF.HL Lines Thickness– толщина линий High/Low HTF.Fill Opacity %– прозрачность заливки тела HTF (по умолчанию 10%).Draw HTF High/Low Lines– включить/выключить линии High/Low HTF (Да/Нет).
Свеча HTF • Бычья
Bull Outline Color– цвет контура для бычьих свечей HTF.Bull Fill Color– цвет заливки для бычьих свечей HTF.
Свеча HTF • Медвежья
Bear Outline Color– цвет контура для медвежьих свечей HTF.Bear Fill Color– цвет заливки для медвежьих свечей HTF.
Для кого это
- Дневные трейдеры и скальперы, которым нужен непрерывный bias HTF без переключения графиков.
- Практики SMC/Wyckoff, которые опираются на структуру старшего таймфрейма при работе на младших TF.
- Все, кто хочет чистый, визуальный контекст HTF, наложенный на их рабочий таймфрейм.
Сводка
ИИ-сводка
Candles_Painter is a multi-timeframe indicator designed to overlay higher timeframe (HTF) candle context onto a lower timeframe chart. It visually colors each bar on the active timeframe according to the bullish or bearish direction of the enclosing HTF candle. The indicator draws filled rectangles representing the HTF candle bodies (open to close, excluding wicks) with customizable fill opacity and separate colors for bullish and bearish candles. Optional HTF high and low lines can also be displayed with adjustable thickness.
Key features include:
- Coloring of all bars within an HTF candle by its direction.
- HTF body overlays for clear visual bias.
- Independent styling for bullish and bearish HTF candles.
- Adjustable transparency for neat integration with price data.
- Configurable lookback period for the number of HTF candles shown.
- Lightweight implementation using native chart objects for performance.
Users can customize parameters such as the higher timeframe to overlay (e.g., daily, 4-hour), colors for bars and HTF candles, opacity, and whether to display HTF high/low lines. This tool is suited for intraday traders, scalpers, and market structure practitioners who require continuous HTF context without switching charts.
Профиль индикатора
Отзывы покупателей
5.0
Отзывы: 2
5 | 100 % | |
4 | 0 % | |
3 | 0 % | |
2 | 0 % | |
1 | 0 % |
Отзывы покупателей
September 1, 2025
The log becomes easier to read, but a manual check is still part of the process.
August 27, 2025
A few ugly trades are useful in the sample, and it makes the setup easier to question.
Обсуждение
Частые вопросы
Продукты, доступные в cTrader Store, включая торговых ботов, индикаторы и плагины, предоставляются сторонними разработчиками и доступны исключительно в информационных и технических целях. cTrader Store не является брокером и не предоставляет инвестиционные консультации, персональные рекомендации или какие-либо гарантии будущей доходности.
Больше от этого автора


Цена
С 26/05/2025
449.3M
Торгуемый объем
61.1K
Выигранные пипы
15
Продажи
1.43K
Бесплатные установки