
Market Entropy
Индикатор
107 скачивания
Версия 1.0, Aug 2025
Windows, Mac
С 26/05/2025
388.58M
Торгуемый объем
60.75K
Выигранные пипы
15
Продажи
1.41K
Бесплатные установки
Описание
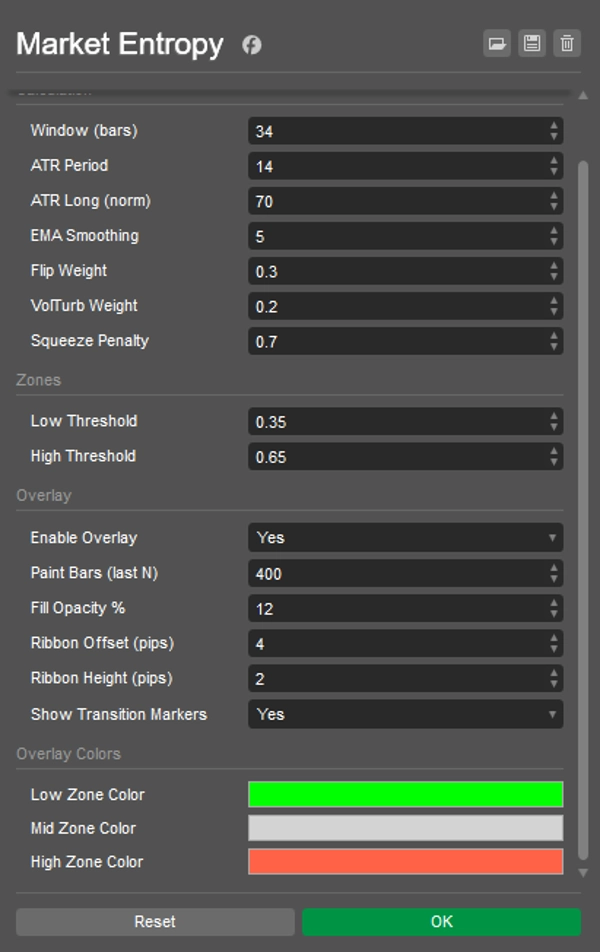
Market Entropy — это двойной индикатор (осциллятор + опциональное наложение цены), который количественно оценивает организацию рынка и сигнализирует о смене режимов по шкале Порядок → Переход → Хаос. Он добавляет вторую линию, Trendness (DC), чтобы отделить истинный тренд от сжатия волатильности.
Как это работает:
- Использует только компоненты OHLCV: DC (направленная согласованность), FlipRate (смены знака), Volatility_n (ATR/ATRlong), VolumeTurb (стандартное отклонение ΔVolume).
- Исходная энтропия:
E0 = 0.5*(1-DC) + 0.3*(FlipRate*VolN) + 0.2*VolumeTurb). - Анти-сжатие снижает E во время сжатий ATR → итоговая Энтропия ∈ [0..1] с сглаживанием EMA.
- Маркеры:
-
- CRYSTAL — пересечение ниже LowThr (появляется порядок: тренд или пред-пробойное сжатие).
- DISSOLVE — пересечение выше HighThr (порядок нарушается: хаос/затухание тренда).
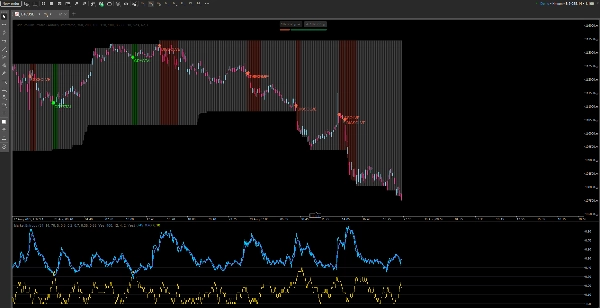
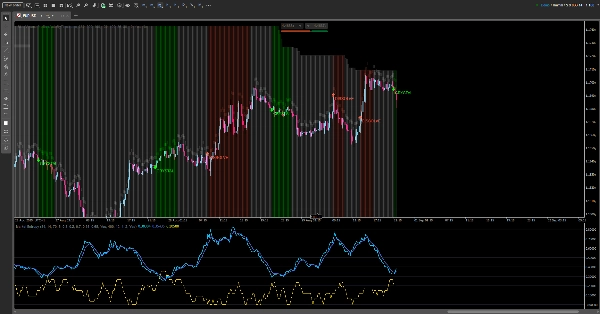
Что вы видите:
- В панели: Entropy, Entropy(EMA), Trendness (DC), пороги Low/High, фоновая зона.
- На графике (включаемо): бары с цветом состояния, тонкая лента над максимумами и маркеры CRYSTAL/DISSOLVE.
Руководство по чтению:
- E < LowThr → Порядок:
-
- с высоким DC → организованный тренд;
- с низким ATR → сжатие (ожидается пробой).
- LowThr…HighThr → Переход: формируется структура; ждите разрешения.
- E > HighThr → Хаос: неопределённость / затухание тренда; избегайте наивных входов на продолжение.
Стратегии:
- Сжатие → CRYSTAL → Пробой/Ретест — торгуйте пробой.
- Тренд → DISSOLVE — фиксируйте часть позиции или ужесточайте риск.
Сводка
Профиль индикатора
Отзывы покупателей
0.0
Отзывы: 0
Отзывы покупателей
У этого продукта еще нет отзывов. Уже попробовали его? Поделитесь впечатлениями!
Обсуждение
Частые вопросы
Продукты, доступные в cTrader Store, включая торговых ботов, индикаторы и плагины, предоставляются сторонними разработчиками и доступны исключительно в информационных и технических целях. cTrader Store не является брокером и не предоставляет инвестиционные консультации, персональные рекомендации или какие-либо гарантии будущей доходности.


Цена
С 26/05/2025
388.58M
Торгуемый объем
60.75K
Выигранные пипы
15
Продажи
1.41K
Бесплатные установки