
Описание
ОБЗОР
Этот индикатор реализует методологию Альфреда Франсуа Тагера "Идентификация тренда с помощью фильтрации по цене и времени", опубликованную в февральском номере 2024 года журнала Technical Analysis of Stocks & Commodities.
Концепция сочетает ценовое движение с фильтрацией по времени для снижения рыночного шума и выявления устойчивых трендов. Вместо реакции на каждое ценовое движение индикатор меняет направление тренда только тогда, когда цена закрытия выходит за пределы диапазона предыдущего периода — условие, сигнализирующее о реальном импульсе, а не случайных колебаниях.
ОСНОВНЫЕ ПРАВИЛА
Исходные правила просты:
- Если закрытие периода превышает максимум предыдущего периода → тренд ВВЕРХ
- Если закрытие периода ниже минимума предыдущего периода → тренд ВНИЗ
- Тренд остается без изменений до наступления условия разворота
Такой подход отфильтровывает незначительные ценовые движения, остающиеся в пределах диапазона предыдущего периода, сосредотачиваясь только на пробоях, демонстрирующих решимость.
ПРИНЦИП РАБОТЫ
Индикатор сравнивает закрытие текущего таймфрейма с максимумом и минимумом предыдущего периода выбранного более высокого таймфрейма:
- Тренд вверх: Текущее закрытие > максимум предыдущего периода
- Тренд вниз: Текущее закрытие < минимум предыдущего периода
- Без изменений: Закрытие остается в пределах диапазона предыдущего периода
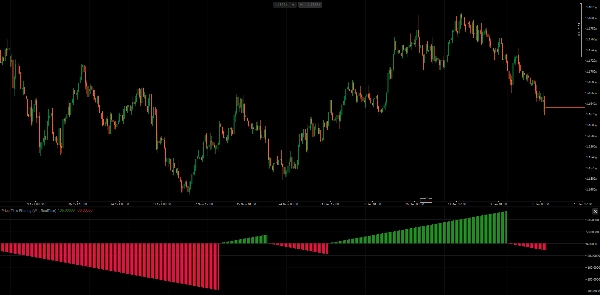
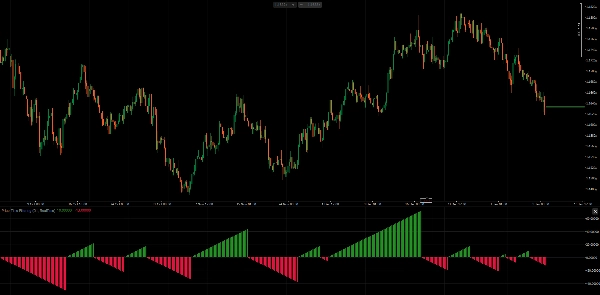
Гистограмма отображает текущий счетчик баров в направлении тренда — положительные значения для восходящих трендов, отрицательные для нисходящих. Это визуализирует как направление, так и продолжительность тренда.
РЕЖИМЫ ФИЛЬТРАЦИИ
1. Режим PeriodEnd Оценивает тренд только при завершении периода более высокого таймфрейма. Это соответствует оригинальной методологии, где недельный тренд определяется закрытием пятницы (или закрытием конца месяца для месячного таймфрейма). Более стабильный, меньше сигналов.
2. Режим RealTime Оценивает тренд на каждом баре, используя текущее закрытие относительно диапазона предыдущего периода. Обеспечивает более ранние сигналы, но может создавать больше шума в течение периода.
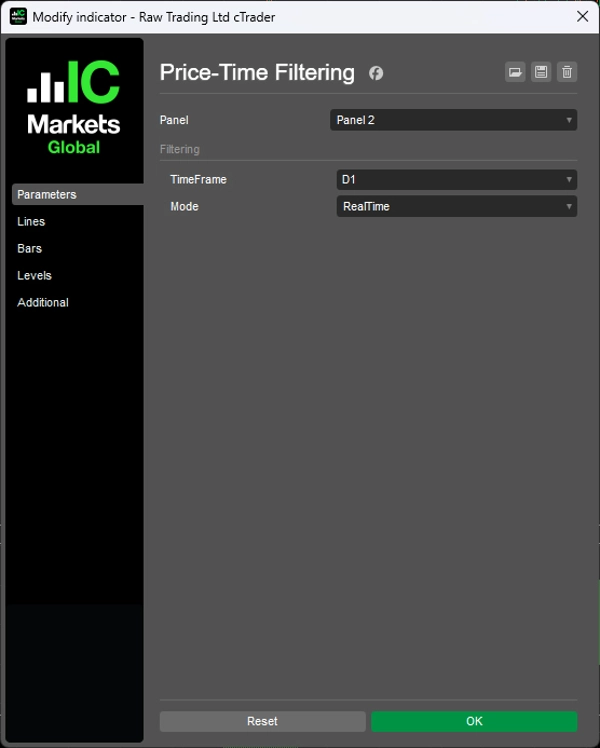
ПАРАМЕТРЫ
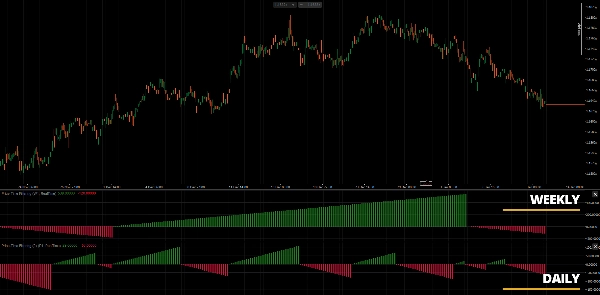
- TimeFrame: Более высокий таймфрейм для оценки тренда (например, Weekly, Monthly)
- Mode: PeriodEnd (оригинальная методология) или RealTime (адаптивный вариант)
ИНТЕРПРЕТАЦИЯ
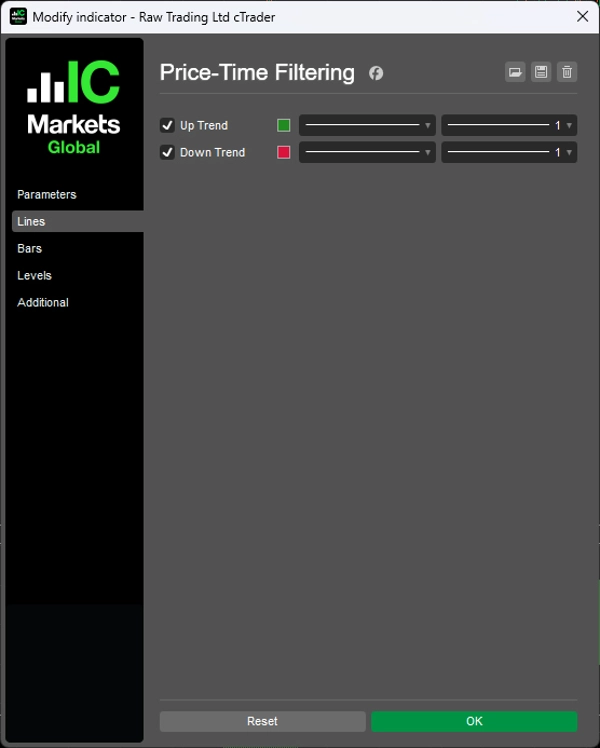
- Зеленая гистограмма: Идет восходящий тренд, счетчик баров показывает продолжительность
- Красная гистограмма: Идет нисходящий тренд, счетчик баров показывает продолжительность
- Сброс гистограммы: Произошел разворот тренда
Индикатор лучше всего работает на дневных графиках с выбором Weekly или Monthly таймфрейма, как описано в оригинальной статье. Однако реализация поддерживает любые комбинации таймфреймов.
ПРИМЕЧАНИЯ
- Изначально разработан для дневных графиков с недельной/месячной оценкой
- Работает на любых комбинациях таймфреймов, где выбранный таймфрейм выше таймфрейма графика
- Счетчик баров дает меру зрелости тренда — более длинные счета указывают на устоявшиеся тренды
- Рекомендуется сочетать с анализом структуры цены для определения времени входа
ИСТОЧНИК
Tagher, Alfred François. "Trend Identification By Price And Time Filtering." Technical Analysis of Stocks & Commodities, February 2024.
__________________________________________________________________________________________
БОЛЬШЕ БЕСПЛАТНЫХ ИНДИКАТОРОВ
Исследуйте широкий спектр инструментов анализа рынка — от структуры и объема до регрессии, волатильности и пользовательских таймфреймов.
Исходный код доступен в репозитории на GitHub repository.
Все бесплатно для использования. Но если хотите поддержать автора кофе, можете сделать это здесь.
Поддержка/Сопротивление
Объем
- Volume Activity Profiler
- Volume Efficiency Analyzer
- Volume Profile Analytics
- Volume Profile - Updated
- Volume Spread Analysis
- VWAP (Volume Weighted Average Price)
Скользящие Средние
- SSL Channel
- Anchored Moving Average
- Deviation-Scaled Moving Average
- Gann High Low Activator
- Instantaneous Trendline
- Kaufman Adaptive MA with Trend Vision
- Moving Average Channel
- Moving Averages Suite
- Trend Channel Moving Average
Утилиты/Пользовательские
Регрессионные
Волатильность
Осцилляторы
__________________________________________________________________________________________
ОТКАЗ ОТ ОТВЕТСТВЕННОСТИ
Торговля связана с риском. Этот индикатор предназначен только для технического анализа — всегда применяйте надлежащее управление рисками и торгуйте ответственно.
ОБРАТНАЯ СВЯЗЬ И УЛУЧШЕНИЯ
Если у вас есть предложения, запросы функций или идеи для улучшения, пожалуйста, оставьте комментарий во вкладке Обсуждение. Ваш отзыв помогает улучшить индикатор для всех.
Сводка
The indicator supports two filtering modes: PeriodEnd mode, which evaluates trends only at the close of a higher timeframe period (e.g., weekly or monthly), providing more stable signals; and RealTime mode, which updates trend status on every bar for more responsive but potentially noisier signals. Users can select the higher timeframe for trend evaluation, typically weekly or monthly, while applying the indicator on lower timeframe charts.
A histogram visually represents trend direction and duration, with positive values and green bars indicating uptrends, negative values and red bars indicating downtrends, and resets marking trend reversals. The indicator is applicable across various markets including Forex, indices, commodities, crypto, and stocks, and supports any timeframe combination where the selected higher timeframe exceeds the chart timeframe.


