
ADXMultiframeIndicator
Indikator
1 käufe
Version 1.0, Oct 2025
Windows, Mac
5.0
Bewertungen: 2
Beschreibung
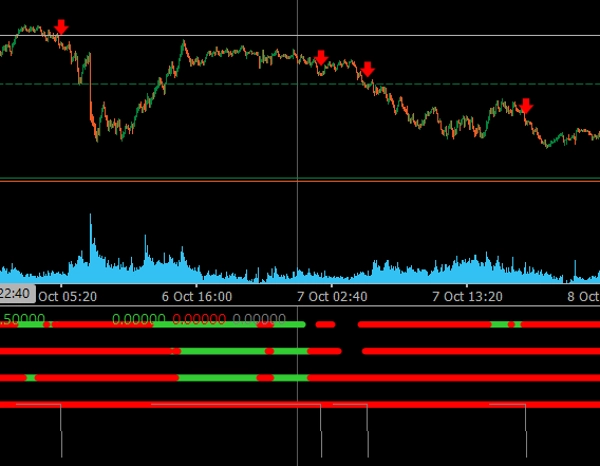
Der Multi-Timeframe ADX Trend Dots & Arrows ist ein professioneller Trading-Indikator für cTrader, der entwickelt wurde, um ausgerichtete Markttrends über mehrere Zeitrahmen hinweg mithilfe des Average Directional Movement Index (ADX) zu identifizieren.
🔹 Hauptmerkmale:
- ✅ Analyse von bis zu 4 anpassbaren Zeitrahmen (M15, H1, H4, Täglich).
- ✅ Farbige Punkte zeigen die Richtungsneigung an (Grün = Aufwärtstrend, Rot = Abwärtstrend).
- ✅ Automatische Pfeile erscheinen, wenn alle Zeitrahmen in dieselbe Richtung ausgerichtet sind.
- ✅ Filter für aufeinanderfolgende Balken reduziert falsche oder vorzeitige Signale.
- ✅ Saubere, moderne Visualisierung, optimiert für dunkle und helle Chart-Themen.
- ✅ Perfekt, um Multi-Timeframe-Bestätigungen und Trendfortsetzungspunkte zu erkennen.
Dieser Indikator ist ideal für Trader, die das große Ganze sehen und nur dann einsteigen, wenn alle Zeitrahmen übereinstimmen, was stärkere und zuverlässigere Trade-Setups ermöglicht.
Zusammenfassung
KI-Zusammenfassung
The ADXMultiframeIndicator is a trading indicator for the cTrader platform that identifies market trends by analyzing the Average Directional Movement Index (ADX) across multiple timeframes. It supports up to four customizable timeframes, including M15, H1, H4, and Daily. The indicator displays colored dots to indicate directional bias—green for uptrends and red for downtrends—and automatically shows arrows when all selected timeframes align in the same direction. A consecutive bars filter is included to reduce false or premature signals. The visualization is designed to be clear and modern, compatible with both dark and light chart themes. This tool assists traders in confirming multi-timeframe trends and identifying trend continuation points by highlighting when all timeframes agree, facilitating more informed trade entries. It is particularly useful for analyzing indices markets.
Indikatorprofil
Kundenbewertungen
5.0
Bewertungen: 2
5 | 100 % | |
4 | 0 % | |
3 | 0 % | |
2 | 0 % | |
1 | 0 % |
Kundenbewertungen
October 28, 2025
the first signal should not decide the only input, but it can look better than it is during a lucky run.
Diskussion
Häufig gestellte Fragen (FAQ)
Indices
Über den cTrader Store verfügbare Produkte, einschließlich Handelsbots, Indikatoren und Plugins, werden von externen Entwicklern bereitgestellt und nur zu Informations- und technischen Zugriffszwecken verfügbar gemacht. cTrader Store ist kein Broker und erbringt keine Anlageberatung, persönlichen Empfehlungen oder eine Garantie für zukünftige Performance.
Mehr von diesem Autor


Preis
Seit 21/01/2025
3
Verkäufe