
Descrição
- Transforme seus gráficos em uma sinfonia visual de clareza de tendência.
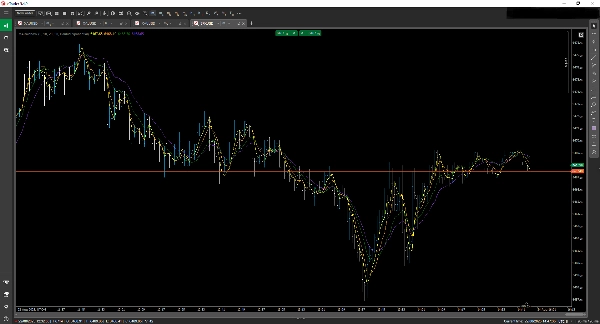
O Indicador MARainbow é uma ferramenta elegante de médias móveis em múltiplas camadas, projetada para traders que exigem precisão, flexibilidade e clareza estética. Seja você um scalper de movimentos intradiários ou um analista de tendências de longo prazo, o MARainbow oferece a vantagem com quatro médias móveis personalizáveis—cada uma codificada por cores para reconhecimento instantâneo.
🔧 Principais Características
• Quatro Médias Móveis Distintas
Exiba até 4 médias móveis simultaneamente, cada uma com sua própria cor e configuração de período para rápida diferenciação visual.
• Vários Tipos de MM
Escolha entre:
• Média Móvel Simples (SMA)
• Média Móvel Exponencial (EMA)
• Média Móvel Exponencial Dupla (DEMA)
• E outros.
Combine e ajuste para adequar à sua estratégia.
• Entradas Personalizáveis
• Selecione períodos individuais para cada MM
• Atribua cores únicas para melhor legibilidade do gráfico
• Alterne a visibilidade de cada linha independentemente
• Clareza de Tendência à Primeira Vista
O efeito arco-íris ajuda você a identificar instantaneamente a direção da tendência, força e potenciais reversões—sem mais dúvidas.
• Otimizado para cTrader
Integra-se perfeitamente à plataforma cTrader, oferecendo desempenho suave e configurações intuitivas.
Resumo
Avaliações de clientes
5 | 0 % | |
4 | 100 % | |
3 | 0 % | |
2 | 0 % | |
1 | 0 % |


