
Beschreibung
Tillson T3 Gleitender Durchschnitt (Adaptiver Glätter)
Überblick:
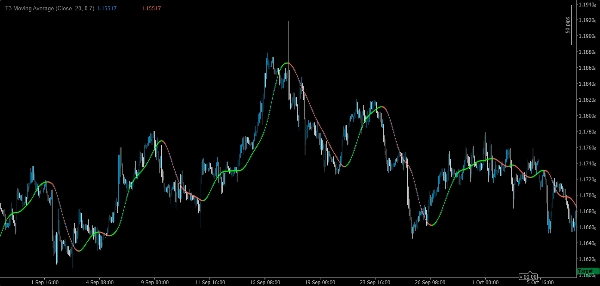
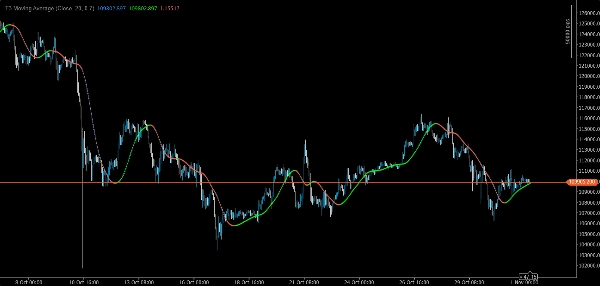
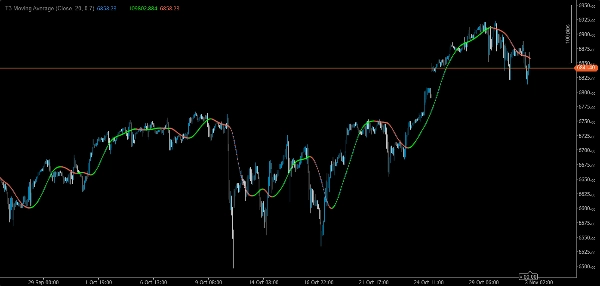
Der Tillson T3 ist ein Gleitender Durchschnitt der nächsten Generation, der außergewöhnliche Glätte bei minimaler Verzögerung bietet. Im Gegensatz zu traditionellen SMA oder EMA wendet der T3 eine Kaskade exponentieller Durchschnitte in Kombination mit einem einstellbaren Volumenfaktor an, was Händlern eine Linie bietet, die sowohl flüssig als auch reaktionsschnell ist. Dies macht ihn ideal zur Identifizierung von Trends, zum Filtern von Rauschen und zum Glätten anderer Indikatoren.
Hauptmerkmale:
• ⚡ Reduzierte Verzögerung: Reagiert schneller auf Preisänderungen als SMA/EMA und vermeidet dabei Fehlsignale.
• 🎯 Ultra-glatte Kurve: Filtert Marktrauschen heraus und macht die Trendrichtung klarer.
• 🔧 Anpassbarer Volumenfaktor: Passt die Reaktionsfähigkeit gegenüber der Glätte an (0,3–0,9).
• 📊 Visuelle Klarheit: Auf- und Abwärtsphasen werden mit farbcodierten Punkten hervorgehoben.
• 🔄 Vielseitige Anwendungsfälle: Kann als eigenständiger Trendfilter, Basislinie für Trailing Stops oder Glätter für Oszillatoren wie RSI/MACD verwendet werden.
• 🛠️ Optimiert für cTrader: Leichtgewichtig, nicht neu zeichnend und kompatibel mit mehreren Zeitrahmen.
Warum diesen Indikator wählen?
Der T3 gilt weithin als eine der effektivsten Glättungstechniken in der technischen Analyse. Er hilft Händlern, länger in profitablen Trends zu bleiben, falsche Signale in unruhigen Märkten zu vermeiden und sich an verschiedene Handelsstile anzupassen. Ob Sie Scalper, Swing-Trader oder Systementwickler sind, der T3 bietet einen verlässlichen Vorteil.
Am besten geeignet für:
• Händler, die einen Trendfilter mit geringer Verzögerung suchen
• Entwickler, die einen modularen Glätter für benutzerdefinierte Strategien benötigen
• Jeder, der einen professionellen Indikator sucht, der Standarddurchschnitte übertrifft
Zusammenfassung
Key features include faster reaction to price changes while minimizing false signals, visual clarity through color-coded points indicating rising and falling phases, and versatile applications such as standalone trend filtering, baseline for trailing stops, or smoothing other oscillators like RSI and MACD. The indicator is optimized for the cTrader platform, ensuring lightweight performance, non-repainting behavior, and compatibility across multiple timeframes.
The T3 Moving Average supports a wide range of markets including forex pairs (EURUSD, GBPUSD), cryptocurrencies (BTCUSD), indices (NAS100, US 500), commodities (XAUUSD), and stocks. It is suitable for various trading styles, from scalping to swing trading, and for developers seeking a modular smoother for custom strategies.


