
VolumeRenkoRange
Indikator
1.4K downloads
Version 1.1, Jan 2026
Windows, Mac
5.0
Bewertungen: 1
Beschreibung
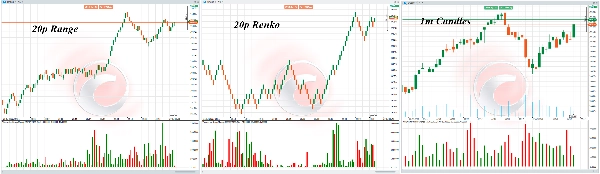
VolumeRenkoRange wendet die Tick-Volumen-Logik auf preisbasierte Charts an.
Verwendet Tick-Daten zur Berechnung des Volumens, genau wie Kerzen.
Das ist möglich, weil wir die Open/Close-Zeit der Kerze haben, also:
Volumenlogik = Anzahl der Preisaktualisierungen (Ticks) während der Bildung der Kerze (zwischen OpenTime und CloseTime).
Was ist neu in rev.1?
Enthält alle Verbesserungen im Zusammenhang mit "Order Flow Aggregated"
- Hochleistungsfähige VolumeTick()
- Asynchrone Tick-Datensammlung
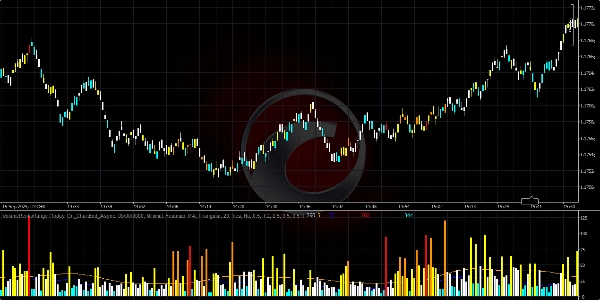
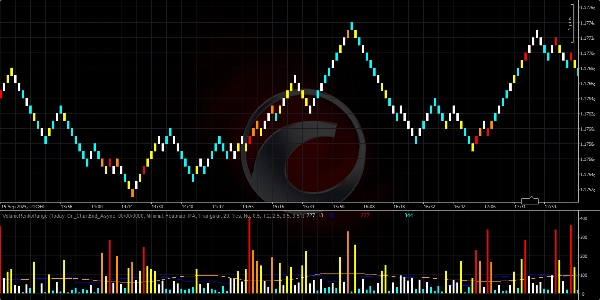
- Heatmap/Fading-Farbgebung
Zusammenfassung
KI-Zusammenfassung
VolumeRenkoRange is an indicator designed for price-based charts such as Renko and Range charts. It applies tick volume logic by calculating the number of price updates (ticks) that occur during the formation of each bar, using the bar's open and close times. This approach enables volume measurement on non-time-based charts similarly to traditional candlestick charts. The indicator incorporates high-performance tick volume calculation, asynchronous tick data collection, and visual enhancements like heatmap and fading coloring to represent volume intensity. It is part of a suite of cTrader Store indicators focused on order flow and volume analysis.
Indikatorprofil
Kundenbewertungen
5.0
Bewertungen: 1
5 | 100 % | |
4 | 0 % | |
3 | 0 % | |
2 | 0 % | |
1 | 0 % |
Kundenbewertungen
July 9, 2025
Pros: Displays volume-based Renko blocks, filtering noise and highlighting impulsive moves. Flexible settings, stable performance. Cons: No tooltips or alerts. No template saving. Requires additional confirmation tools for reliable trading decisions.
Diskussion
Häufig gestellte Fragen (FAQ)
VWAP
Über den cTrader Store verfügbare Produkte, einschließlich Handelsbots, Indikatoren und Plugins, werden von externen Entwicklern bereitgestellt und nur zu Informations- und technischen Zugriffszwecken verfügbar gemacht. cTrader Store ist kein Broker und erbringt keine Anlageberatung, persönlichen Empfehlungen oder eine Garantie für zukünftige Performance.


Preis
Seit 12/12/2024
1
Verkäufe
33.23K
Kostenlose Installationen