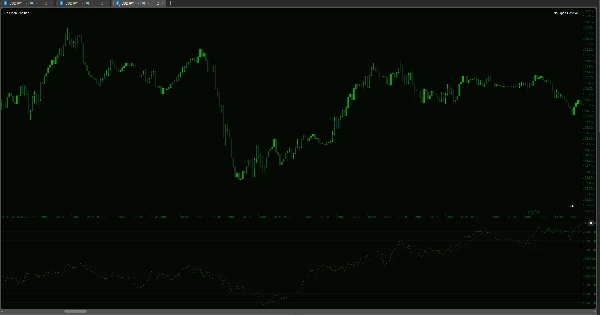
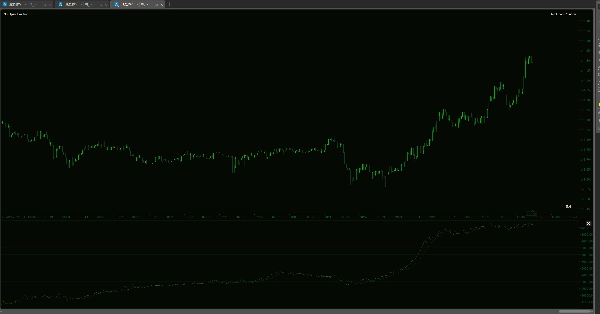
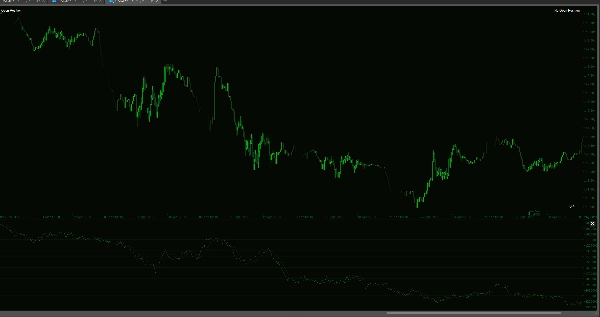
Wskaźnik
usdjpy
signal
Logo „On Balance Volume USD - Combined”
On Balance Volume USD - Combined
0.0
03/09/2025
1
Desktop

Imagine having a single line that tells you exactly where dollars are flowing in the FX market—no more bouncing between six different charts. That’s what the USD Composite OBV delivers. It blends on‑balance volume readings from EUR/USD, GBP/USD, AUD/USD, USD/JPY, USD/CHF and USD/CAD into one clean signal that shows you real buying and selling of the U.S. dollar.

You’ll instantly see when big players are loading up on dollars or unloading them, and spot early warning signs of breakouts or reversals. It even automatically flips its readings so every up‑move equals dollar demand and every down‑move equals dollar supply—no manual tweaks needed. Swap in any USD pair you like, and you’ve got a tailored momentum gauge in seconds.

Whether you’re hunting fast news‑driven moves or riding longer‑term swings, this indicator keeps you locked onto true dollar strength. Add it to your toolbox and trade with the confidence of knowing exactly who’s driving the market.


--------------------------

Please feel free to check out my other indicators!

https://ctrader.com/products/1181

https://ctrader.com/products/1182

https://ctrader.com/products/1180

https://ctrader.com/products/1015

https://ctrader.com/products/555

https://ctrader.com/products/553

https://ctrader.com/products/554

https://ctrader.com/products/552

https://ctrader.com/products/557

https://ctrader.com/products/845

https://ctrader.com/products/848

https://ctrader.com/products/847

https://ctrader.com/products/846

https://ctrader.com/products/551

https://ctrader.com/products/574

https://ctrader.com/products/573

https://ctrader.com/products/556

https://ctrader.com/products/558

https://ctrader.com/products/559

https://ctrader.com/products/560


More from this author
Market Sessions - Free
Track major trading sessions (Tokyo, London, New York) with customizable colors and visual sessions on your chart.
Supply Demand V1-Premium
Auto-detect supply & demand zones, remove broken levels, and trade smarter with real-time alerts. Precision made simple.
Supply Demand - BasicV1
Supply and demand zones. They're important. Here's a free version to get you started!
MTF Candle Window - On Chart
The Multi-Timeframe Candle Indicator displays candles from multiple timeframes in one window, enhancing market analysis!
VWAP - London Open
VWAP Set to London Open
Volume Profile Triple Line - POC Median Mode
The Advanced Volume Profile Indicator calculates POC, Median, and Mode, revealing key price levels for smarter trading.
Market Sessions V2_NSC
Market Session V2: Full Control. colors, history, session/text toggles, font size. Elevate your strategy!
Supply Demand Premium V2_NSC
The long awaited new and improved Supply Demand Premium V2 indicator. Unlock greater trading opportunities now!
VWAP Tokyo Open
VWAP Set to Tokyo Open
Wskaźnik
indices
commodities
CCI - With Arrows and 40 80 EMA Logic_noSourceCode
The Advanced CCI & EMA Indicator combines the CCI with 40 & 80 EMA logic to generate precise arrows signaling direction
Open Trade PipsV1
This indicator tracks the unrealised amount of pips in your open positions.
MTF Candle Countdown
Stay ahead with a real-time countdown to candle closes on all key timeframes: 5m, 15m, 30m, 1H, 4H, and Daily.
Wskaźnik
forex
indices
eurusd
+2
US Dollar Index
US Dollar Index
Wskaźnik
forex
eurusd
usdjpy
4 Currencies V2_NSC
Relative Currency Strength 4 Currencies: AUD USD EUR JPY
Open Trade ProfitV1
A simple indicator that tracks the value of your open trades in pips.
Commodity Channel Index Smoothed w Alerts_NSC
Smoothed CCI alerts! Audio & arrow signals for +/-100 crosses. Custom sounds & arrow filters. Precision trading!
Wskaźnik
forex
indices
eurusd
+1
DXY w HMA
DXY HMA Indicator
Wskaźnik
forex
usdjpy
scalping
+1
8 Currencies_NSC
RCS: 8 majors! AUD,USD,EUR,JPY,GBP,CAD,CHF,NZD. Find how strong each currency is relatively and trade smarter!
Możesz także polubić
Wskaźnik
breakout
BreakOut_Probability_Expo
Break Out Probability Experimental indicator. Credits for this indicator goes to Zeiierman !!!
Wskaźnik
signal
macd
TradingViewMACD
Enhance your trading strategy with our customizable TradingViewMACD indicator. Optimize and elevate your market analysis
Ctreder Smart SMA Indicator
cTreder Smart SMA
TraderMaxBBFilterX
TraderMax BB Filter X (FULL) for cTrader 📈 A premium signal tool based on Bollinger Bands + Trend Filter Designed for
MTF Candle Countdown
Stay ahead with a real-time countdown to candle closes on all key timeframes: 5m, 15m, 30m, 1H, 4H, and Daily.
Wskaźnik
breakout
btcusd
supertrend
+5
Auto-Trend Channel
Adaptive trend channel using linear regression and Pearson correlation for dynamic support, resistance, and trends.
LDE - Market Sessions
🇫🇷 Visualisez vos sessions de marché et OPR d'un coup d’œil 🇬🇧 Visualize your market sessions & OPR at a glance !
zh-cn Variety Period clock panel(multilanguage)
This indicator can be used to: change color, shape size, position, change font, increase or decrease, and other function
Daily Weekly Monthly - Highs & Lows
Daily/Weekly/Monthly - Highs & Lows Indicator (Customizable Settings)
Wskaźnik
forex
indices
rsi
+1
FiboTrend-Pro
😎Read the description before purchasing💩
Market Sessions
Market Sessions is very important for traders.
Wskaźnik
scalping
Pivot Point Smart Money Concept
Transform your approach to trading with our innovative Pivot Point Indicator.
DMI CUSTOM SESSIONS
This will allow you to have SESSIONS on the chart. London, New York, Asian session and you can customize the times.
Indicatore livelli numeri tondi_fabio23.traders
Indicatore dei livelli numeri tondi sul grafico , regolabile.Indicator of levels round numbers on the graph, adjustable
Golden Boom And Crash Spike Detector
Golden Boom and Crash Spike Detector is a trading tool designed for Crash 300 and Boom 300 indices on M1 Timeframe.
Wskaźnik
breakout
supertrend
rsi
Adaptive Trend Channel
📊 Visualize market trends more clearly and dynamically
RT Stochastic RSI PRO
Unlock Stochastic RSI PRO in cTrader! Overlay RSI, highlight zones, and identify divergences with customizable settings.
RSI T3 Overbought and oversold areas
Three parameter RSI