

present
Registrieren Sie sich und erhalten Sie $50 Rabatt auf Ihren ersten Kauf
Trading product for Central Pivot Range Indikator Key Levels AI-assisted, image 1
Central Pivot Range
Indikator
Version 1.0, Aug 2026
Windows, Mac
Trading product for Central Pivot Range Indikator Key Levels AI-assisted, image 2
Trading product for Central Pivot Range Indikator Key Levels AI-assisted, image 3
Trading product for Central Pivot Range Indikator Key Levels AI-assisted, image 4
Trading product for Central Pivot Range Indikator Key Levels AI-assisted, image 5
Trading product for Central Pivot Range Indikator Key Levels AI-assisted, image 6
Trading product for Central Pivot Range Indikator Key Levels AI-assisted, image 7
Seit 07/05/2026
5
Verkäufe
63
Kostenlose Installationen

Beschreibung

Central Pivot Range (CPR) ist eines der am weitesten verbreiteten Intraday-Werkzeuge unter professionellen Daytradern, aber die meisten CPR-Indikatoren zeichnen nur drei Linien und hören dort auf. Central Pivot Range Pro implementiert die tatsächliche CPR-Theorie, die professionelle Trader verwenden, um den Tag *vor* seinem Verlauf zu lesen – nicht nur die Levels selbst.


**Was es analysiert:** das Hoch, Tief und den Schluss der vorherigen Sitzung, um den heutigen Pivot, den oberen Central Pivot (TC) und den unteren Central Pivot (BC) zu erstellen, und legt dann zwei statistische Auswertungen darüber, die einfache CPR-Plotter nicht haben:


- **CPR-Breiten-Perzentil** — die heutige CPR-Breite wird im Vergleich zur jüngsten Historie bewertet. Eine schmale CPR (unteres Perzentil) geht statistisch Trend- und Ausbruchstagen voraus; eine breite CPR (oberes Perzentil) geht tendenziell Range-gebundenen, unruhigen Tagen voraus. Der Indikator sagt Ihnen, welchen Typ Sie vor Beginn der Sitzung vor sich haben.

- **2-Tages-CPR-Beziehung** — klassifiziert die heutige CPR im Vergleich zu der von gestern anhand des vollständigen professionellen Rahmens: **Höherer Wert** (bullishe Fortsetzung), **Niedriger Wert** (bearishe Fortsetzung), **Unveränderter Wert** (Trendfortsetzung, geringe Volatilität), **Innerer Wert** (unruhig, Range-gebunden), **Äußerer Wert** (volatil, Umkehrungsrisiko) oder **Überlappend** (seitwärts/unsicher). Jeder hat eine eindeutige, gut dokumentierte Marktimplikation.


**Wie man es liest:**

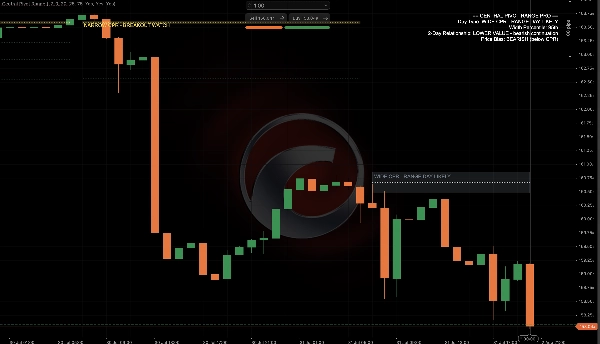
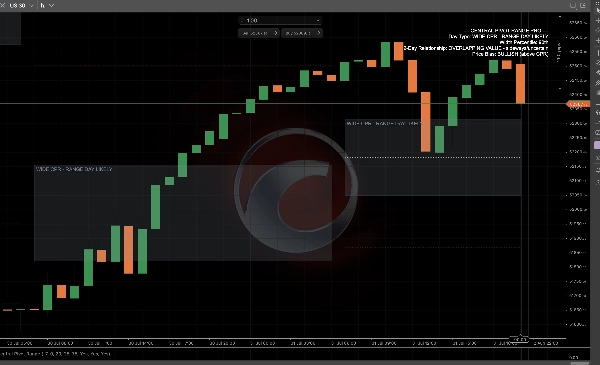
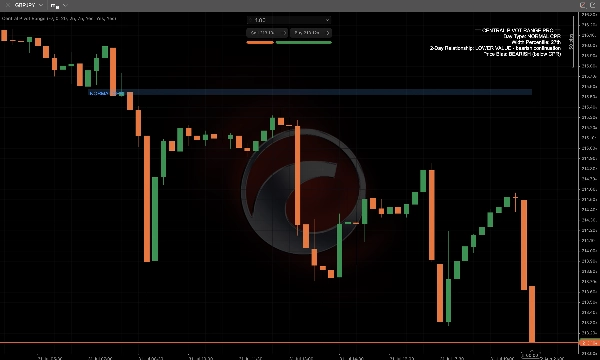
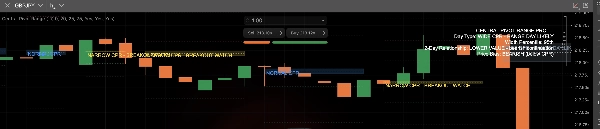
- Das schattierte CPR-Feld ist farblich abgestuft: **gold** bedeutet eine schmale CPR (Ausbruchswatch), **grau-blau** bedeutet eine breite CPR (wahrscheinlicher Range-Tag), **blau** ist ein Tag mit normaler Breite.

- Standardmäßige S1-S3/R1-R3 Pivot-Level werden als sekundäre Referenzebene geplottet, die unabhängig ein- und ausgeschaltet werden kann.

- Ein Live-HUD-Panel gibt Ihnen die einfache Erklärung: Tagestyp, Breitenperzentil, 2-Tages-Beziehung und ob der Preis aktuell bullisch (über CPR), bärisch (unter CPR) oder neutral (innerhalb CPR) handelt.


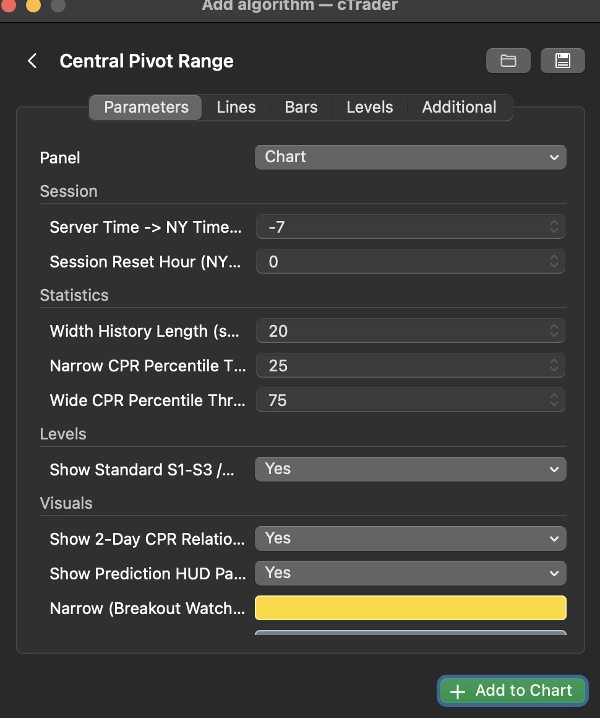
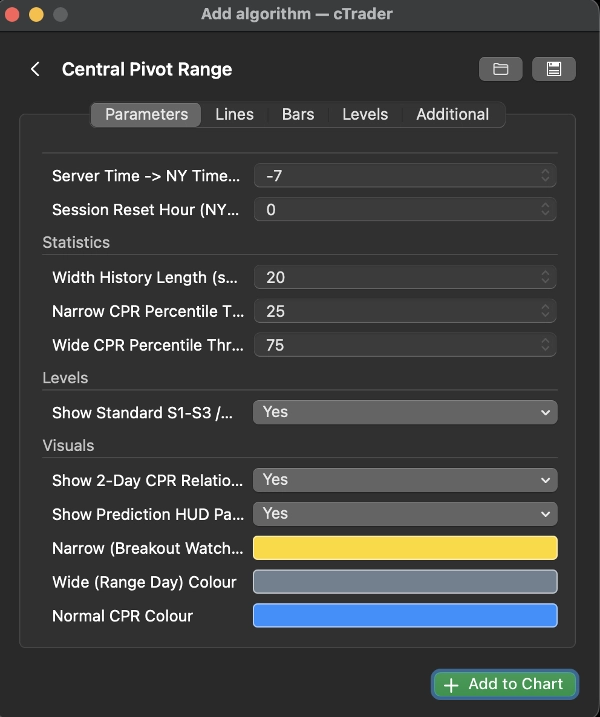
**Wichtige Einstellungen:** Sitzungs-Reset-Zeit (mit einem Serverzeit-zu-NY-Offset für genaue tägliche Resets), Länge der Breitenhistorie und Perzentilschwellen für schmale/breite Klassifizierung sowie unabhängige Umschalter für Standardlevels und Beziehungstags.


**Typische Anwendungsfälle:** Vorhersage, ob die kommende Sitzung wahrscheinlich einen Trend oder Seitwärtsbewegung zeigt, bevor sie eröffnet wird; Nutzung der 2-Tages-Beziehung zur Antizipation von Fortsetzungs- vs. Umkehrungstagen; Kombination der CPR-Breite mit eigenen Setups als Volatilitätsfilter; Verwendung der CPR-Position (bullisch/bärisch/neutral) als Bias-Check für die Sitzung.


**Am besten geeignet für:** Intraday- und Daytrader bei Forex-Majors, Indizes und Gold, die eine objektive, statistisch fundierte Einschätzung des kommenden Tages wünschen, anstatt nur drei einfache Linien. Weniger relevant für reine langfristige Positions-Trader.


Zusammenfassung

KI-Zusammenfassung
Central Pivot Range (CPR) is an intraday trading indicator that extends traditional pivot analysis by predicting the upcoming trading day’s behavior. It calculates today’s Pivot, Top Central Pivot (TC), and Bottom Central Pivot (BC) levels from the previous session’s high, low, and close. Beyond plotting these levels, it provides two key statistical insights:

1. CPR Width Percentile: Ranks the current CPR width against recent history to indicate likely day types—narrow widths suggest potential breakout/trend days, while wide widths indicate range-bound, choppy sessions.

2. 2-Day CPR Relationship: Compares today’s CPR range to yesterday’s, classifying market conditions into categories such as bullish continuation, bearish continuation, trend continuation, choppy, volatile reversal risk, or sideways uncertainty, each with distinct implications.

The indicator visually encodes CPR width with color shading (gold for narrow, grey-blue for wide, blue for normal) and includes standard pivot levels (S1-S3, R1-R3) as optional overlays. A live HUD panel summarizes day type, width percentile, 2-day relationship, and current price position relative to CPR (bullish, bearish, neutral).

Key settings allow customization of session reset timing, width history length, percentile thresholds, and display toggles. This tool is designed for intraday and day traders focusing on forex majors, indices, and gold who seek an objective, statistically grounded forecast of daily market structure and volatility.
Indikatorprofil
Indikatorkategorie
Marktstruktur (SMC)
Ausgabetyp
Visualisierung
Signale
Datenanforderungen
Tick-Daten
Unterstützte Signale
Trendstärke

Kundenbewertungen

0.0
Bewertungen: 0
Kundenbewertungen
Bisher gibt es keine Bewertungen für dieses Produkt. Haben Sie es schon ausprobiert? Dann können Sie die erste Person sein, die andere darüber informiert!

Diskussion

Häufig gestellte Fragen (FAQ)

Key Levels
AI-assisted
Liquidity Sweep
Market Structure
Supply & Demand
ATR
Support & Resistance
Über den cTrader Store verfügbare Produkte, einschließlich Handelsbots, Indikatoren und Plugins, werden von externen Entwicklern bereitgestellt und nur zu Informations- und technischen Zugriffszwecken verfügbar gemacht. cTrader Store ist kein Broker und erbringt keine Anlageberatung, persönlichen Empfehlungen oder eine Garantie für zukünftige Performance.

Mehr von diesem Autor

Indikator
AI-assisted
Order Block
+5
The daily bias estimator indicator uses ICT concepts to show whether the chart is bullish or bearish on multi-time frame
Indikator
ATR
BOS
+5
Full ICT/SMC 4-step setup checker that alerts a long or short setup.
Indikator
Volume
Fibonacci
+5
Classic 9:30 Opening Range Breakout — auto-plots the range, flags volume-confirmed breakouts long or short, live.
Indikator
Flag
VWAP
+5
Session VWAP with statistical deviation bands, gradient cloud, and live rejection alerts — see exactly how stretched pri
Indikator
MSS
AI-assisted
+5
Live ICT Silver Bullet detection: liquidity sweeps, structure shifts, and killzone-gated FVGs, graded and glowing in rea
Indikator
Triangle
Double Top
+5
Know which liquidity sweeps are real. Auto-tracks EQH/EQL and confirms genuine reversals, not just broken levels.
Indikator
BOS
EMA
+5
Directional volume heatmap: see if a price zone was built on buying or selling, not just how much.
Indikator
ATR
MSS
+5
Grades ICT Unicorn setups (Breaker Block + FVG confluence) into PRIME / SETUP / WATCH, with retest & RR targets.
Indikator
BOS
Volume
+5
20/40/60-day IPDA lookback ranges, Premium/Discount/Equilibrium zones, and quarterly shift alerts — anchored to true dai
Indikator
BOS
MSS
+5
One indicator, full ICT/SMC picture — structure, OBs, FVGs, liquidity, Premium/Discount — with graded PRIME/SETUP signal
Indikator
ATR
Volume
+5
Order blocks with measured hold-rate stats and confidence scoring — not just zones on a chart.
Indikator
BOS
CHOCH
+5
BOS/CHoCH signals confirmed by liquidity sweep + FVG confluence, with a live conviction score.

Das könnte Sie auch noch interessieren

Indikator
AI
ATR
+23
The ZigZag Trend is a market structure tool that filters out small price fluctuations and highlights major swing.
Indikator
Key Levels
Spots key hourly ranges and signals breakouts using arrows & colored background zones. Ideal for Gold.
Indikator
ATR
Key Levels
It combines the trend-filtering power of Renko charts with the volatility tracking of ATR Bands
Indikator
BOS
MSS
+5
WinSMC is an overlay SMC indicator for cTrader. It helps you visually identify!
Indikator
Key Levels
Market Structure
+1
HTF Candle Projector displays the current Higher Timeframe candle (4H or 1H) as a real projected candle LIVE..
Indikator
Pin Bar
Inside Bar
+2
Advanced candlestick pattern recognition with structural quality scoring, alerts and adaptive chart visuals.
Indikator
Breakout
Institutional Flow Radar scans the chart for abnormal volume events and classifies them into two groups: Capital &Public
Indikator
Allow trader to draw multi trendlines in different timeframes on one chart,Give trader an overview of the current market
Indikator
BOS
CHOCH
+5
BOS/CHoCH signals confirmed by liquidity sweep + FVG confluence, with a live conviction score.
Indikator
Volume
Key Levels
+2
Support and resistance from a rolling volume profile, ranked by strength or recency, updated live.
Indikator
Forex
BTCUSD
+8
The traditional Hull Moving Average with different colours based on the slope (direction) of the trend.
Indikator
Signal
USDJPY
See USD demand in one line—Composite OBV fuses six major FX pairs into a clear momentum gauge.
„Swing Points“-Logo
Beste Ratings
4.5
(6)
$19
Indikator
AI
SMC
+15
Multi-Timeframe Swing Points Indicator for cTrader that identifies swing highs and lows on both the current timeframe.
Indikator
ATR
SMC
+2
HTF POWER 3 ICT Power of 3 · M1 Precision · H4 Intelligence Auto-detect Accumulation → Manipulation → Distribution
Indikator
Signal
Fractal Arrow Buy and Sell Indicator
Indikator
Block Liquidity,indicator.Block Order, Liquids Stops, Signal Sentiment,signal correctio.
Indikator
ATR
MSS
+5
Grades ICT Unicorn setups (Breaker Block + FVG confluence) into PRIME / SETUP / WATCH, with retest & RR targets.
Indikator
Master RSI reversals with Parabolic SAR precision! Get real-time alerts for high-probability trend changes.

Preis

Seit 07/05/2026
5
Verkäufe
63
Kostenlose Installationen





























