
Market Bias Dashboard
Indikator
Version 1.0, Jul 2026
Windows, Mac
Trading product for Market Bias Dashboard Indikator Premium/Discount  Key Levels, image 2
Trading product for Market Bias Dashboard Indikator Premium/Discount  Key Levels, image 3
Trading product for Market Bias Dashboard Indikator Premium/Discount  Key Levels, image 4

Beschreibung

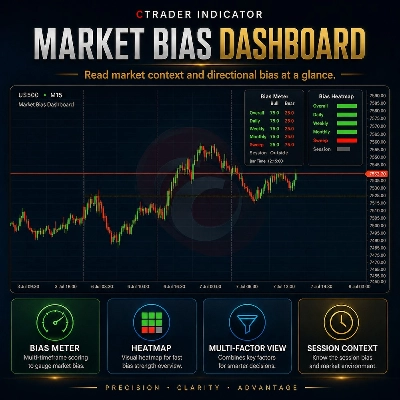
Market Bias Dashboard ist ein visueller cTrader-Indikator, der entwickelt wurde, um den Marktkontext direkt in Ihrem Chart zusammenzufassen.


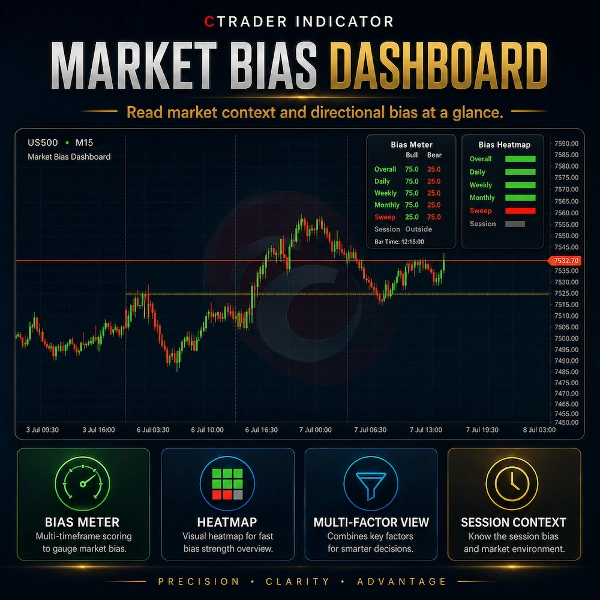
Das Dashboard bewertet ausgewählte Referenzpunkte der Kursbewegung wie Gleichgewichtsniveaus des vorherigen Tages, der vorherigen Woche und des vorherigen Monats, den aktuellen Sitzungsstatus und den zuletzt erkannten Liquiditätssweep. Das Ergebnis wird in einem klaren Bias Meter und Bias Heatmap Layout angezeigt.


Wichtig: Die angezeigten Bull/Bear-Werte sind keine statistischen Wahrscheinlichkeiten, keine Live-Marktsentimentdaten oder Vorhersagen der Gewinnrate von Trades. Sie sind feste visuelle Kontextzustände, die das Dashboard leichter lesbar machen.


Das Dashboard verwendet die folgende Zustandslogik:


Bullischer Kontext: 75 / 25

Neutraler oder gemischter Kontext: 50 / 50

Bärischer Kontext: 25 / 75


Zum Beispiel, wenn der Preis über einem ausgewählten Gleichgewichtsniveau liegt, kann diese Komponente als bullischer Kontext angezeigt werden. Liegt der Preis darunter, kann sie als bärischer Kontext angezeigt werden. Wenn der Kontext unklar, nicht verfügbar oder gemischt ist, kann er als neutral angezeigt werden.


Hauptmerkmale:

- Sauberes Bias Meter Panel

- Bias Heatmap Panel

- Gleichgewichtskontext des vorherigen Tages, der Woche und des Monats

- Premium- / Discount-Kontextansicht

- Aktueller Sitzungsstatus

- Optionaler Liquiditätssweep-Kontext

- Optionale Referenzlinien

- Einstellbare Panel-Position

- Benutzerdefinierte Farben und Anzeigeeinstellungen

- Store-sicherer Indikator mit eingeschränkten Zugriffsrechten


Market Bias Dashboard ist nur ein Chart-Visualisierungs- und Marktkontext-Tool. Es führt keine Trades aus, ändert keine Aufträge und liefert keine garantierten Kauf- oder Verkaufssignale.


Trading beinhaltet Risiken. Dieser Indikator bietet keine Finanzberatung, keine Anlageempfehlungen, keine statistischen Wahrscheinlichkeiten oder garantierte Handelsergebnisse.


Zusammenfassung

KI-Zusammenfassung
Market Bias Dashboard is a cTrader indicator that visually summarizes market context on your chart. It evaluates key price action reference points including previous day, week, and month equilibrium levels, current session status, and recent liquidity sweeps. These elements are presented through a Bias Meter and Bias Heatmap, indicating bullish, bearish, or neutral market states based on price positioning relative to equilibrium levels. The dashboard’s bias states use fixed visual values (bullish: 75/25, neutral: 50/50, bearish: 25/75) to simplify interpretation and do not represent probabilities or trading signals. Features include premium/discount context views, optional liquidity sweep indicators, adjustable panel positioning, customizable colors and display settings, and reference lines. The tool is designed solely for market context visualization and does not execute trades or provide financial advice. It supports analysis of trend strength and reversal signals using bar data and is categorized under trend indicators. Tags associated with the product highlight its focus on structure and smart money concepts such as key levels, liquidity grabs, and risk dashboards.
Indikatorprofil
Indikatorkategorie
Trend
Ausgabetyp
Visualisierung
Datenanforderungen
Nur Balken
Unterstützte Signale
Wendepunkt
Trendstärke

Kundenbewertungen

0.0
Bewertungen: 0
Kundenbewertungen
Bisher gibt es keine Bewertungen für dieses Produkt. Haben Sie es schon ausprobiert? Dann können Sie die erste Person sein, die andere darüber informiert!

Diskussion

Häufig gestellte Fragen (FAQ)

Premium/Discount
Key Levels
Liquidity Sweep
Risk Dashboard
Liquidity Grab
Über den cTrader Store verfügbare Produkte, einschließlich Handelsbots, Indikatoren und Plugins, werden von externen Entwicklern bereitgestellt und nur zu Informations- und technischen Zugriffszwecken verfügbar gemacht. cTrader Store ist kein Broker und erbringt keine Anlageberatung, persönlichen Empfehlungen oder eine Garantie für zukünftige Performance.

Mehr von diesem Autor

Indikator
SMC
Prop
+6
Automatically draws the Opening Range (High & Low) for Tokyo, London, and New York sessions. Configurable start times,
Indikator
Liquidity Grab
Liquidity Sweep
+2
Visualizes accumulation ranges, manipulation sweeps and distribution phases on your cTrader chart.
Indikator
BOS
Key Levels
+2
Maps bullish and bearish order block zones, CE levels and structure-based price action context.
Indikator
MSS
Key Levels
+4
Maps session ranges, previous highs/lows, equilibrium and premium/discount zones on your cTrader chart.
Indikator
SMC
Prop
+12
Killzone, ICT, SMC, Session, Asia, London, New York, NY PM, Session High, Session Low, Smart Money, Order Flow, Trading
Indikator
MSS
Key Levels
+2
Maps equal highs, equal lows and active liquidity pools directly on your cTrader chart.
Indikator
EMA
RSI
+2
Compact premium cTrader dashboard for market bias, sessions, premium/discount context, liquidity direction, ADR range an
Indikator
BOS
MSS
+3
Maps BOS, CHoCH, swing breaks and market structure shifts directly on your cTrader chart.
Indikator
SMC
Prop
+12
Shows bullish/bearish bias for 5 timeframes in one panel. Three bias methods, alignment summary, fully configurable.

Das könnte Sie auch noch interessieren

Indikator
Forex
EURUSD
+3
ATR-normalized MA slope in degrees, comparable across all instruments. Color-coded labels flag strong trend moves.
Indikator
BOS
CHOCH
+2
The full SMC suite: structure BOS CHoCH MSS , FVG, liquidity, order blocks & a 0 to100 confluence score. No repaint.
Indikator
SMC
Prop
+16
Multi-Time Frame Candlesticks FVG with BSL/SSL Premium Suite
Indikator
AI-assisted
Order Block
+5
The daily bias estimator indicator uses ICT concepts to show whether the chart is bullish or bearish on multi-time frame
Indikator
Overlay HTF context on any chart: color bars by HTF and draw filled HTF bodies with optional High/Low lines.
Indikator
Forex
Crypto
+3
Consecutive Series Moves — Reveal the True Pulse of Price Action
Indikator
Forex
BTCUSD
+11
Auto-detects Bullish/Bearish Engulfing patterns to spot trend reversals. Real-time alerts, custom colors, all symbols.
Indikator
Forex
BTCUSD
+11
Catch High-Probability Reversals with Precision Swing
Indikator
Indices
Multi-Timeframe ADX Trend Dots & Arrows
Indikator
Prop
E7 BBKG indicator with 80% plus accuracy used to show both, possible reversal and trend.
Indikator
VWAP
Volume
+3
Don't trust static support and resistance levels, this indicator combines Fibonacci and VWAP in one powerful tool.
Indikator
Forex
Alerts you when price touches Fibonacci levels. Stay organized and trade efficiently!
Indikator
ATR
Prop
+14
Optimize exits with Chandelier Exit! Visualize stop-loss points dynamically for improved trading precision and safety.
Indikator
Drawdown Monitor
Proprietary trading desk risk monitoring dashboard!
Indikator
AI
ATR
+27
Support and Resistance with signals
Indikator
News Filter
External Data
+3
Real-time financial news and economic calendar overlay for cTrader with smart alerts
Indikator
Forex
Indices
+1
Professional Fair Value Gaps with multitimeframe spot on
Indikator
Forex
BTCUSD
+7
🚀 TMAX RBA Indicator - The Ultimate Multi-Timeframe Momentum System 🚀

Preis
























