„SessionOpiningRange“-Logo
Indikator
1 käufe
Version 1.0, Apr 2026
Windows, Mac
4.0
Bewertungen: 1
In „SessionOpiningRange“ hochgeladenes Bild
Seit 07/10/2025
1
Verkäufe

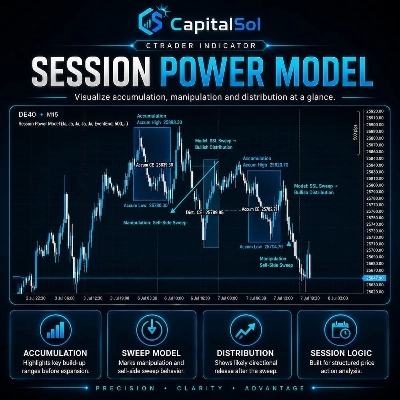
Session Opening Range — Tokio · London · New York


Zeichnet automatisch die Opening Range für die drei wichtigsten Handelssitzungen direkt in Ihrem cTrader-Chart. Keine manuellen Zeichnungen, keine verpassten Levels — der Indikator berechnet und zeigt alles in Echtzeit an.


─────────────────────────────

HAUPTMERKMALE

─────────────────────────────


► Drei Sitzungen

Tokio, London und New York — jede Sitzung ist vollständig unabhängig mit eigener Startzeit, Farbe und Umschalter.


► Konfigurierbare Dauer der Opening Range

Legen Sie die Dauer der Range in Minuten fest (Standard: 15 Min.). Der Indikator markiert automatisch das Hoch und Tief der ersten N Minuten nach Sitzungsbeginn.


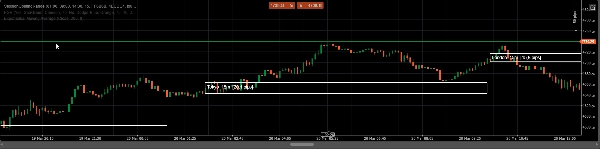
► Hoch- / Tief-Linien

Klare horizontale Linien am Hoch und Tief der Sitzung — die wichtigsten Levels für Ausbruchs- und Umkehr-Trades.
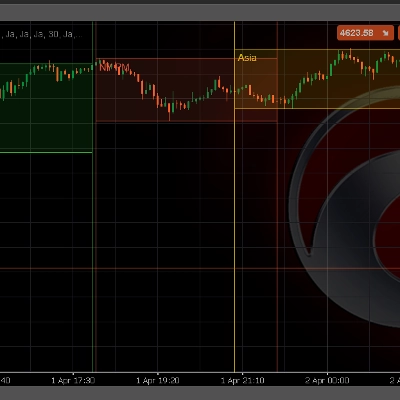

► Zonenfüllung

Optionale Hintergrundfüllung für die Opening Range Zone. Hilft Ihnen, die Range auf jedem Zeitrahmen sofort zu erkennen.


► Sitzungsbeschriftungen

Schalten Sie Beschriftungen direkt im Chart ein, um immer zu wissen, welche Sitzungszone Sie betrachten.


─────────────────────────────

STANDARD-SITZUNGSZEITEN (UTC+1)

─────────────────────────────


Tokio → 01:00

London → 09:00

New York → 14:30


Alle Startzeiten sind vollständig anpassbar, um mit der Zeitzone Ihres Brokers übereinzustimmen.


─────────────────────────────

ANLEITUNG

─────────────────────────────


1. Befestigen Sie den Indikator an einem beliebigen Chart und Zeitrahmen.

2. Stellen Sie Ihre Sitzungsstartzeiten so ein, dass sie mit der Serverzeit Ihres Brokers übereinstimmen (Standard: UTC+1).

3. Definieren Sie die Dauer der Opening Range in Minuten.

4. Aktivieren oder deaktivieren Sie bei Bedarf die Zonenfüllung und Beschriftungen.


Die Hoch- und Tief-Level der Sitzung sind Ihre wichtigsten Bezugspunkte für den Handelstag — verwenden Sie sie für Ausbruchseinstiege, Stop-Setzung und Liquiditätsziele.


─────────────────────────────

IDEAL FÜR

─────────────────────────────


✔ ICT / SMC-Trader, die mit Killzone-Konzepten arbeiten

✔ Opening Range Breakout (ORB)-Strategien

✔ Sitzungsbasierte Liquiditäts- und Manipulationsanalyse

✔ FTMO / Prop-Firm-Trader, die eine klare Sitzungsstruktur benötigen


─────────────────────────────

KOMPATIBILITÄT

─────────────────────────────


Plattform : cTrader (Windows & Mac)

Sprache : C# / cAlgo

Zeitrahmen: Alle (M1 bis W1)

Instrumente: Forex, Gold, Indizes, Krypto

Indikatorprofil
Indikatorkategorie
Marktstruktur (SMC)
Ausgabetyp
Visualisierung
Datenanforderungen
Nur Balken
Unterstützte Signale
Wendepunkt
Eröffnungsspanne der Sitzung
Ausbruch
4.0
Bewertungen: 1
5
0 %
4
100 %
3
0 %
2
0 %
1
0 %
Kundenbewertungen
April 16, 2026
Prop
Forex
Breakout
Indices
Commodities
SMC
Crypto
XAUUSD
Über den cTrader Store verfügbare Produkte, einschließlich Handelsbots, Indikatoren und Plugins, werden von externen Entwicklern bereitgestellt und nur zu Informations- und technischen Zugriffszwecken verfügbar gemacht. cTrader Store ist kein Broker und erbringt keine Anlageberatung, persönlichen Empfehlungen oder eine Garantie für zukünftige Performance.

Mehr von diesem Autor

Indikator
SMC
Prop
+12
Killzone, ICT, SMC, Session, Asia, London, New York, NY PM, Session High, Session Low, Smart Money, Order Flow, Trading
Indikator
SMC
Prop
+12
Shows bullish/bearish bias for 5 timeframes in one panel. Three bias methods, alignment summary, fully configurable.
Indikator
ATR
SMC
+12
ATR-based SL and TP1/2/3 levels with pip labels and R-multiples. Essential risk tool for FTMO and prop firm traders.

Das könnte Sie auch noch interessieren

Indikator
ATR
Flag
+5
Decision panel with Buy/Sell scores, market bias, setup quality, trading cost and clear trade reasons.
Indikator
ATR
Prop
+14
Optimize exits with Chandelier Exit! Visualize stop-loss points dynamically for improved trading precision and safety.
Indikator
Key Levels
Drawdown Monitor
+1
Real-time position monitor with break-even levels, MTF pivots, profit targets & alerts. Essential risk tool.
Indikator
SMC
Grid
+19
Smart fractals + auto Fibonacci + dynamic S/R zones with HTF confluence & Bull/Bear bias panel. Institutional-grade.
Indikator
RSI
BTCUSD
+5
Identify market structure effortlessly with swing highs, lows, CHoCH, and BOS levels for smart trading decisions! 📊🔍"
Indikator
AI
Grid
+17
🔍 Discover All Candlestick Patterns… Absolutely Free!
Indikator
Moving Average
An Indicator made for scalping. Shows you the Sniper movement on Chart with the colour signals.
Indikator
AI-assisted
Predictive Monte Carlo Engine Forecast future price paths using institutional-grade statistical models and probability
„PMAX“-Logo
Beste Ratings
5.0
(6)
Kostenlos
Indikator
ATR
Supertrend
It's a combination of two trailing stop loss and the other one is well-known ATR-based SuperTrend.
Indikator
MACD
Prop
+14
Enhance MACD Histogram! Visualize bull and bear price changes with vibrant colors for clearer, more insightful trading.
Indikator
ATR
SMC
+2
HTF POWER 3 ICT Power of 3 · M1 Precision · H4 Intelligence Auto-detect Accumulation → Manipulation → Distribution
Indikator
The Break of Structure (BoSCHoCh) Indicator is a smart market structure tool designed to help traders easily spot trend.
Indikator
RSI
XAUUSD
+2
Automatic ZigZag swings with dynamic support & resistance levels, labeling highs/lows for clear trend signals.
Indikator
SMC
Forex
+7
The Fair Value Gap (FVG) Indicator identifies inefficiencies in price action where an imbalance occurs due to aggressive
Indikator
Grid
Prop
+16
Those who are involved in trading know how important it is to take into account the previous session. With Order Block
Indikator
SMC
Signal
+2
Gold Market Maker Zones; Non-repainting Supply & Demand detector for XAUUSD. Precise institutional zones for cTrader.
Indikator
ADX
ATR
+5
Signal Quality Score - 0-100 filter combining RSI, Volume, ATR, Trend Strength & Alignment. Works on ANY chart type.
Indikator
XAUUSD
Professional Volume Profile Indicator - Shows volume distribution, POC, Value Areas & Buy/Sell pressure.
Seit 07/10/2025
1
Verkäufe