Trading product for Session Power Model Indikator Liquidity Sweep Market Structure, image 1
Indikator
Version 1.0, Jul 2026
Windows, Mac
Trading product for Session Power Model Indikator Liquidity Sweep Market Structure, image 2
Trading product for Session Power Model Indikator Liquidity Sweep Market Structure, image 3
Trading product for Session Power Model Indikator Liquidity Sweep Market Structure, image 4
Trading product for Session Power Model Indikator Liquidity Sweep Market Structure, image 5
Seit 07/10/2025
2
Verkäufe

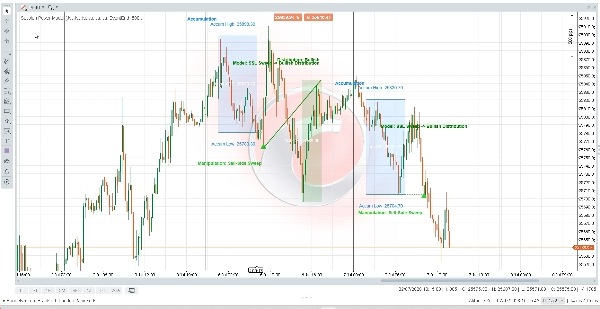
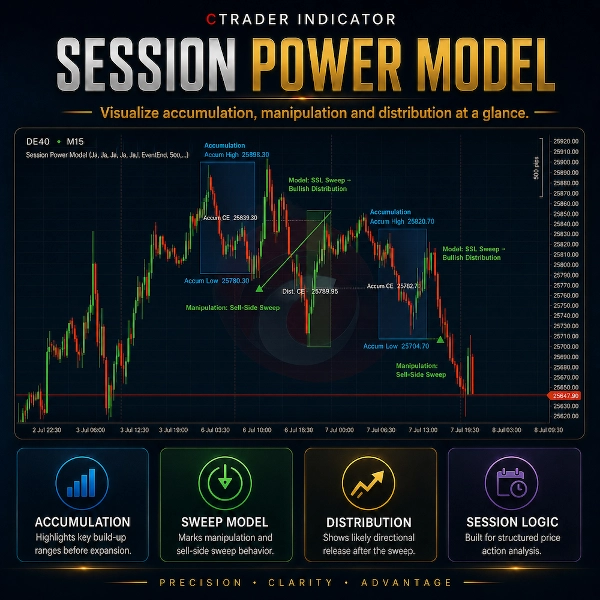
Session Power Model is a visual cTrader indicator designed to help traders analyze recurring session behavior directly on the chart.


The indicator divides the trading day into three configurable phases: accumulation, manipulation and distribution. It marks the accumulation range, detects potential liquidity sweeps during the manipulation window and visualizes the following distribution phase.


The model can identify sell-side sweeps leading into a bullish distribution context, buy-side sweeps leading into a bearish distribution context, and mixed days where both sides are swept.


Main features:

- Accumulation range visualization

- Manipulation sweep detection

- Bullish and bearish distribution phase display

- Session CE lines

- Sweep arrows

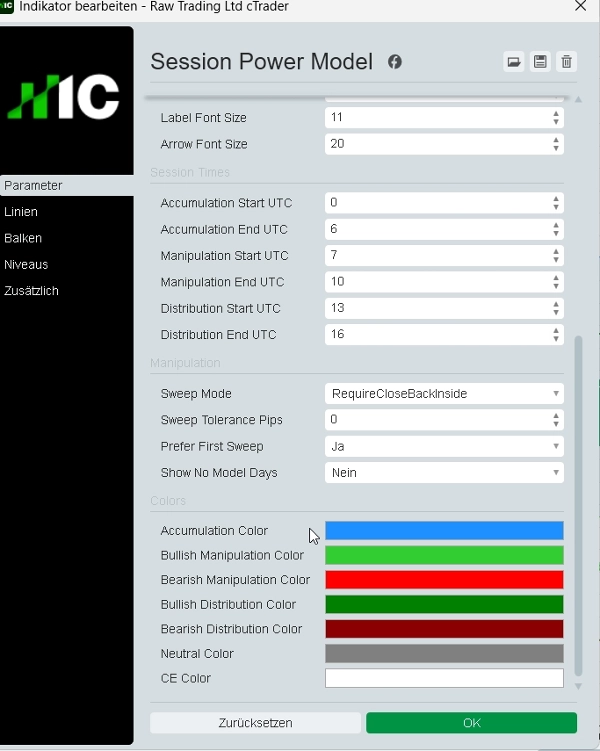
- Configurable session times

- Adjustable lookback days

- Right-edge label placement

- Clean chart overlay

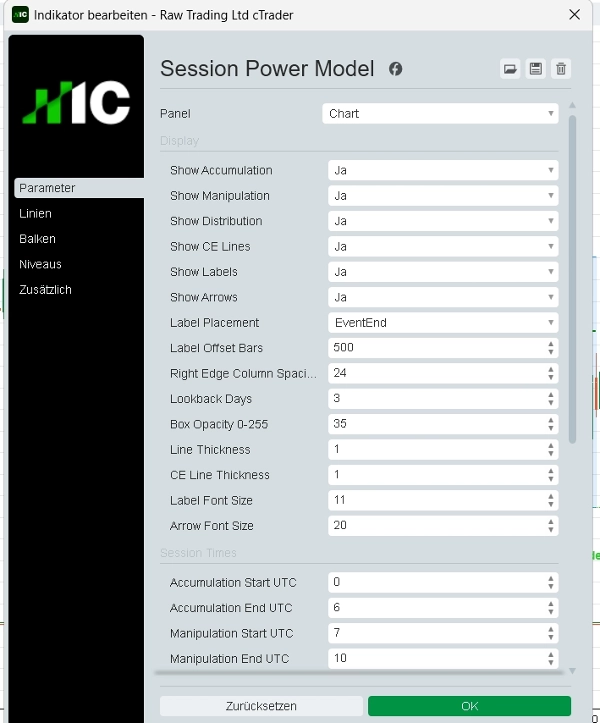
- Custom colors, opacity and label settings

- Store-safe indicator with restricted access rights


Session Power Model is designed for discretionary price action analysis, liquidity-based chart review, session research and backtesting preparation.


This indicator is not a trading robot. It does not execute trades, modify orders or provide guaranteed buy/sell signals. It is a chart visualization and market context tool only.


Trading involves risk. This indicator does not provide financial advice, investment recommendations, statistical probabilities or guaranteed trading results.

Indikatorprofil
Indikatorkategorie
Marktstruktur (SMC)
Ausgabetyp
Visualisierung
Datenanforderungen
Nur Balken
Unterstützte Signale
Abweichung
Ausbruch
Wendepunkt
0.0
Bewertungen: 0
Kundenbewertungen
Bisher gibt es keine Bewertungen für dieses Produkt. Haben Sie es schon ausprobiert? Dann können Sie die erste Person sein, die andere darüber informiert!
Liquidity Sweep
Market Structure
Liquidity Grab
Support & Resistance
Über den cTrader Store verfügbare Produkte, einschließlich Handelsbots, Indikatoren und Plugins, werden von externen Entwicklern bereitgestellt und nur zu Informations- und technischen Zugriffszwecken verfügbar gemacht. cTrader Store ist kein Broker und erbringt keine Anlageberatung, persönlichen Empfehlungen oder eine Garantie für zukünftige Performance.

Mehr von diesem Autor

Indikator
SMC
Prop
+6
Automatically draws the Opening Range (High & Low) for Tokyo, London, and New York sessions. Configurable start times,
Indikator
SMC
Prop
+12
Killzone, ICT, SMC, Session, Asia, London, New York, NY PM, Session High, Session Low, Smart Money, Order Flow, Trading
Indikator
SMC
Prop
+12
Shows bullish/bearish bias for 5 timeframes in one panel. Three bias methods, alignment summary, fully configurable.
Indikator
MSS
Key Levels
+4
Maps session ranges, previous highs/lows, equilibrium and premium/discount zones on your cTrader chart.
Indikator
Key Levels
Liquidity Grab
+3
Visual market context dashboard showing bias states, CE positioning, session status and sweep context.
Indikator
MSS
Key Levels
+2
Maps equal highs, equal lows and active liquidity pools directly on your cTrader chart.
Indikator
BOS
Key Levels
+2
Maps bullish and bearish order block zones, CE levels and structure-based price action context.
Indikator
BOS
MSS
+3
Maps BOS, CHoCH, swing breaks and market structure shifts directly on your cTrader chart.

Das könnte Sie auch noch interessieren

Indikator
BOS
MSS
+3
Maps BOS, CHoCH, swing breaks and market structure shifts directly on your cTrader chart.
Indikator
Key Levels
Market Structure
+1
Sessions, ICT killzones, multi-ORB and previous levels. One clean, no-repaint cTrader overlay.
Indikator
ATR
Breakout
Detects swing highs/lows, structure, breakouts, trend lines, and fibs — great for price action trading.
Indikator
Forex
Crypto
+4
Auto Trend Line Indicator for cTrader
Indikator
AI
SMC
+11
Perfect Entry Price designed to help traders identify the most accurate and reliable price levels for market entries
Indikator
Forex
EURUSD
+4
Check the correlations between dozens of assets in one elegant display.
Indikator
ATR
Volume
+1
The UT Bot identify potential trend reversals and momentum shifts.
Indikator
AI
ATR
+26
Liquidity Cluster Order automatically detects and draws accumulation zones & distribution zones
Indikator
Volume
Key Levels
+5
Volume Profile Pro - A Lightweight and Highly Customizable Volume Profile
Indikator
ZigZag
Indices
+2
Auto Trendlines, Fibonacci, Pitchfork and Patterns from non‑repainting pivots. One‑click Presets, targeted Alerts, and a
Indikator
Key Levels
Liquidity Grab
+3
Visual market context dashboard showing bias states, CE positioning, session status and sweep context.
Indikator
Prop
Forex
+4
Pivot Points Standard — All-in-One Multi-Timeframe Pivot Indicator for cTrader
Indikator
Forex
cTrader ZigZag Alerts: Precision Swing Detection, Alerts, and Fibonacci.
Indikator
Signal
Breakout
+1
Bolliger Bands + Hamster-Coder™ Timeframe Decoupling
Indikator
Forex
Real-Time Candlestick Pattern Detection with Custom Alerts & Trend Analysis for cTrader
Indikator
Forex
Crypto
+2
Market Structure Indicator – Your Trading Map in a Noisy Market. No more Panicking Which one, Where, Why and How.
Indikator
ATR
A lightweight Multi Time Frame bias dashboard for quickly spotting market direction across multiple timeframes.
Indikator
ATR
BTCUSD
+5
Trailing algo 📈 auto-tracks trends 🎯 adapts to volatility 🌟 precise moves 🛡️ retest signals 🚀 no lag, smart market
Seit 07/10/2025
2
Verkäufe