Killzone-Indicator
Wskaźnik
Wersja 1.0, Apr 2026
Windows, Mac
4.0
Opinie: 1
Trading product for Killzone-Indicator Wskaźnik Forex Breakout, image 2
Trading product for Killzone-Indicator Wskaźnik Forex Breakout, image 3
Trading product for Killzone-Indicator Wskaźnik Forex Breakout, image 4

Opis

Wskaźnik sesji Killzone — Azja · Londyn · Nowy Jork · NY PM

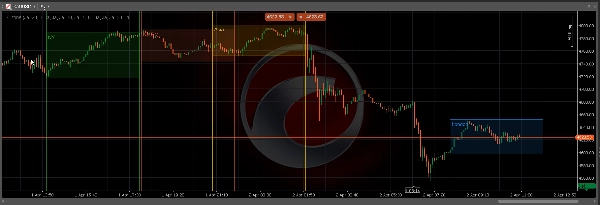
Automatycznie podświetla wszystkie cztery główne sesje ICT Killzone bezpośrednio na wykresie cTrader. Bez ręcznych rysunków, bez pominiętych okien — wskaźnik oblicza i wyświetla każdą strefę sesji w czasie rzeczywistym.

─────────────────────────────

KLUCZOWE CECHY

─────────────────────────────

► Cztery sesje

Azja, Londyn, Nowy Jork i NY PM — każda sesja jest całkowicie niezależna z własnym czasem rozpoczęcia, zakończenia, kolorem i przełącznikiem.

► Podświetlenie tła

Opcjonalny wypełniony prostokąt dla każdej strefy sesji — natychmiastowe rozpoznanie aktywnej Killzone na dowolnym interwale czasowym.

► Linie High / Low

Wyraźne linie poziome na poziomach High i Low sesji — kluczowe poziomy do manipulacji, odwrócenia i potwierdzenia wejścia.

► Pionowe linie graniczne

Opcjonalne pionowe linie na otwarciu i zamknięciu sesji — dla czystego wizualnego oddzielenia sesji.

► Dowolny wybór koloru

Każda sesja ma własny natywny wybór koloru cTrader z regulowaną przezroczystością (0–255).

► Konfigurowalny zakres wsteczny

Rysuj do 60 dni historycznych stref sesji — idealne do testów wstecznych i analizy sesji.

─────────────────────────────

DOMYŚLNE CZASY SESJI (UTC)

─────────────────────────────

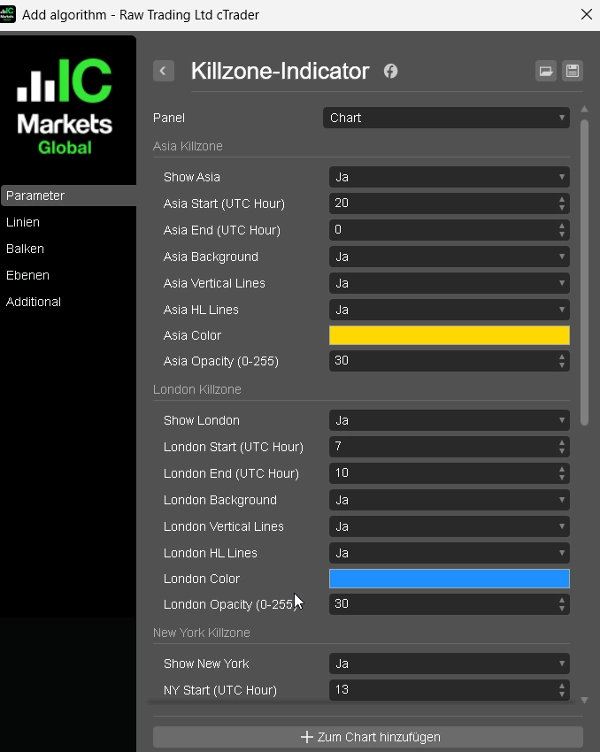
Azja → 20:00 – 00:00

Londyn → 07:00 – 10:00

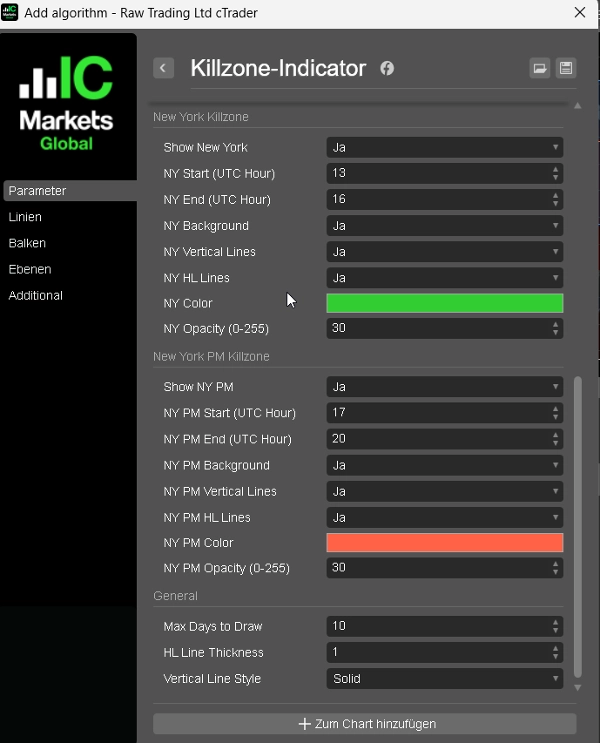
Nowy Jork → 13:00 – 16:00

NY PM → 17:00 – 20:00

Wszystkie czasy są w pełni regulowane, aby dopasować się do czasu serwera twojego brokera.

─────────────────────────────

JAK UŻYWAĆ

─────────────────────────────

1. Dołącz wskaźnik do dowolnego wykresu i interwału czasowego.

2. Dostosuj czasy sesji, aby pasowały do czasu serwera twojego brokera (domyślnie UTC).

3. Włącz lub wyłącz tło, linie pionowe i linie HL dla każdej sesji.

4. Wybierz preferowany kolor i przezroczystość dla każdej sesji.

5. Ustaw Max Days, aby kontrolować, ile historycznych sesji jest rysowanych.

Poziomy High i Low sesji są twoimi głównymi punktami odniesienia — używaj ich do wejść Killzone, ustawiania stopów i celów płynności.

─────────────────────────────

IDEALNE DLA

─────────────────────────────

✔ Traderów ICT / SMC pracujących z koncepcjami Killzone

✔ Analizy manipulacji i odwrócenia opartej na sesjach

✔ Handel konfluencją Order Block i Fair Value Gap

✔ Traderów FTMO / firm prop, którzy potrzebują jasnej struktury sesji

─────────────────────────────

KOMPATYBILNOŚĆ

─────────────────────────────

Platforma : cTrader (Windows & Mac)

Język : C# / cAlgo

Interwały : Wszystkie (M1 do W1)

Instrumenty: Forex, Złoto, Indeksy, Kryptowaluty

Podsumowanie

Podsumowanie AI
The Killzone Session Indicator for cTrader automatically highlights four major ICT Killzone trading sessions—Asia, London, New York, and New York PM—directly on your chart in real time. Each session is independently configurable with customizable start and end times, colors, and toggles. The indicator visually marks session zones with optional background highlights and vertical boundary lines for clear separation. It also plots horizontal lines at each session’s high and low levels, which serve as key reference points for manipulation, reversal, and entry confirmation. Users can adjust opacity and colors per session and set a configurable lookback period to display up to 60 days of historical session zones, aiding in backtesting and analysis. The default session times are set in UTC but can be adjusted to match any broker’s server time. Compatible with all timeframes (M1 to W1) and instruments including Forex, Gold, Indices, and Crypto, this indicator supports traders employing ICT, Smart Money Concepts, order flow, and session-based strategies. It is designed for use on the cTrader platform (Windows and Mac) and coded in C# (cAlgo).
Profil wskaźnika
Kategoria wskaźnika
Struktura rynku (SMC)
Typ wyjścia
Wizualizacja
Wymagania dotyczące danych
Tylko słupki
Obsługiwane sygnały
Przecięcie
Przełamanie
Odwrócenie trendu
Przebicie poziomu
Zakres otwarcia sesji

Opinie klientów

4.0
Opinie: 1
5
0 %
4
100 %
3
0 %
2
0 %
1
0 %
Opinie klientów
April 5, 2026
The decision feels less rushed, but the stop still matters.

Dyskusja

Częste pytania

Forex
Breakout
Indices
EURUSD
Commodities
GBPUSD
NZDUSD
Prop
Fair Value Gap
SMC
Stocks
XAUUSD
NAS100
USDJPY
Produkty dostępne za pośrednictwem cTrader Store, w tym boty handlowe, wskaźniki i wtyczki, dostarczane są przez deweloperów zewnętrznych i udostępniane wyłącznie w celach informacyjnych oraz w celu zapewnienia dostępu technicznego. cTrader Store nie jest brokerem i nie zapewnia doradztwa inwestycyjnego, nie udziela spersonalizowanych rekomendacji ani nie gwarantuje przyszłych wyników.

Więcej od tego autora

Wskaźnik
SMC
Prop
+6
Automatically draws the Opening Range (High & Low) for Tokyo, London, and New York sessions. Configurable start times,
Wskaźnik
BOS
Key Levels
+2
Maps bullish and bearish order block zones, CE levels and structure-based price action context.
Wskaźnik
Liquidity Grab
Liquidity Sweep
+2
Visualizes accumulation ranges, manipulation sweeps and distribution phases on your cTrader chart.
Wskaźnik
EMA
RSI
+2
Compact premium cTrader dashboard for market bias, sessions, premium/discount context, liquidity direction, ADR range an
Wskaźnik
MSS
Key Levels
+2
Maps equal highs, equal lows and active liquidity pools directly on your cTrader chart.
Wskaźnik
MSS
Key Levels
+4
Maps session ranges, previous highs/lows, equilibrium and premium/discount zones on your cTrader chart.
Wskaźnik
BOS
MSS
+3
Maps BOS, CHoCH, swing breaks and market structure shifts directly on your cTrader chart.

Możesz także polubić

Wskaźnik
IVB 2.0 is an indicator that works on the strategy of imbalance of the maximum volatility box of indices
Wskaźnik
ATR
RSI
+6
Market structural patterns , specifically the concepts of Change of Character (ChoCH) 🔄 and Break of Structure (BoS) 💥
Wskaźnik
VWAP
Forex
+13
Custom VWAP Indicator for cTrader
Wskaźnik
Forex
Crypto
Bar Close Alert Manager provides real-time alerts for bar closures with customizable notifications and automation.
Wskaźnik
EMA
SMA
+3
Pro MA Close Alert. Powerful indicator that instantly notifies you when price closes above or below your selected MA.
Wskaźnik
Drawdown Monitor
Proprietary trading desk risk monitoring dashboard!
Wskaźnik
AI
SMC
+5
Coloring trendline/ Colored Trendline / Color Trendline
Wskaźnik
VWAP
Volume
+3
Don't trust static support and resistance levels, this indicator combines Fibonacci and VWAP in one powerful tool.
Wskaźnik
📊 Smart Floating Risk Pro – Advanced Risk Management for cTrader
Wskaźnik
Smart Liquidity Zones PRO auto-detects liquidity grabs, wicks, traps & manipulations — trade like the smart money.
Wskaźnik
News Filter
External Data
+3
Real-time financial news and economic calendar overlay for cTrader with smart alerts
Wskaźnik
Forex
Crypto
+2
Unique Pyramid Design , Clear Price Action Trend
Wskaźnik
Prop
Forex
+15
The best filter for trading trend continuations on Renko charts.
Wskaźnik
Prop
E7 BBKG indicator with 80% plus accuracy used to show both, possible reversal and trend.
Wskaźnik
ATR
Upgrade to ATR-RMA! Experience the precise ATR using Relative Moving Average for accurate volatility analysis in cTrader
Wskaźnik
MSS
Key Levels
+2
Maps equal highs, equal lows and active liquidity pools directly on your cTrader chart.
Wskaźnik
BOS
MSS
+5
WinSMC is an overlay SMC indicator for cTrader. It helps you visually identify!
Wskaźnik
Forex
cTrader Auto Support & Resistance detects key levels with Fibonacci analysis and sends real-time trading alerts.

Cena