Description
ApexRangeCompass
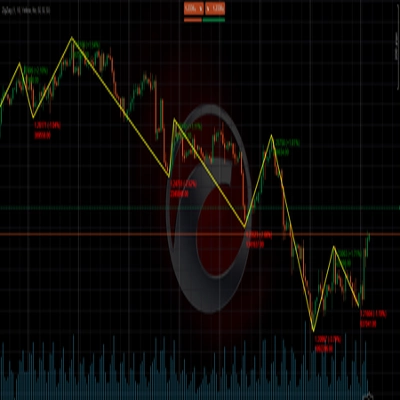
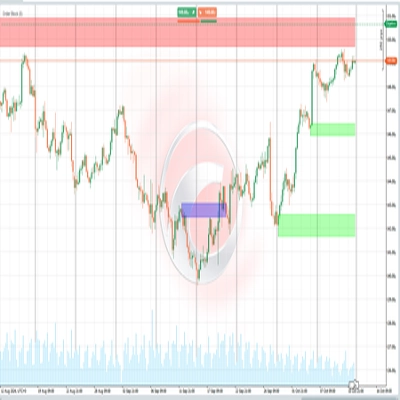
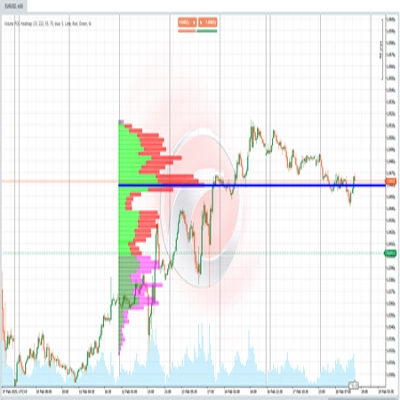
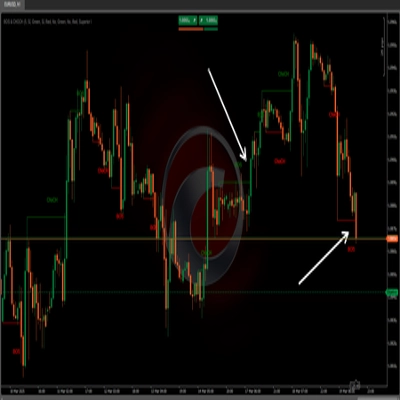
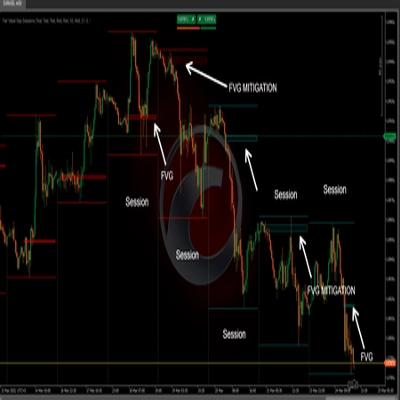
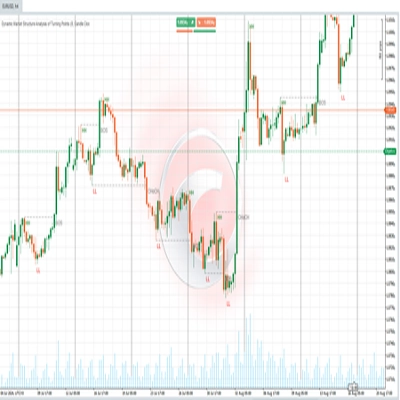
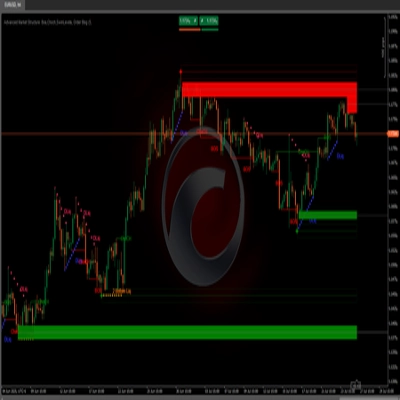
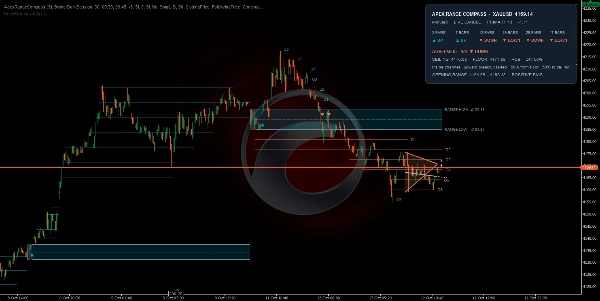
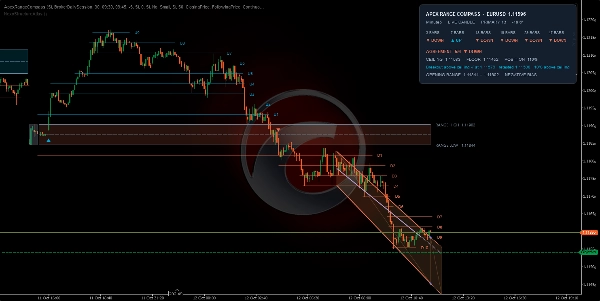
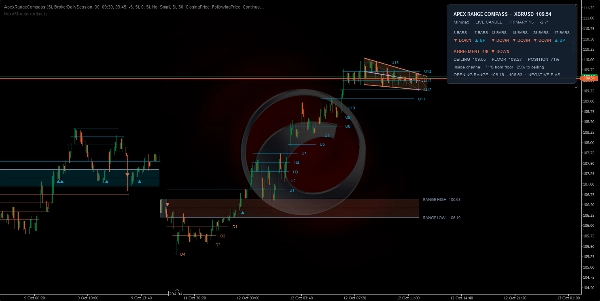
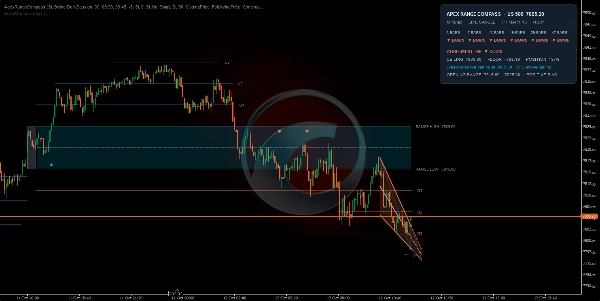
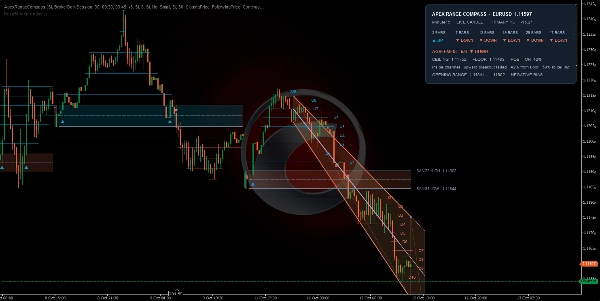
combines an opening range, a dynamic trend channel and a six-scale direction panel in one chart overlay. It helps intraday traders organise breakout, pullback and retest analysis around visible price levels.
https://chartshots.spotware.com/c/6acd1c264c524
- 📊 Indicator type: Opening range, trend structure and breakout/retest analysis.
- https://chartshots.spotware.com/c/6acd1c56f137b
- 🎯 Preferred use: Liquid forex pairs, indices, metals and crypto instruments available through your broker. Start with M5 or M15 time-based charts and select an opening window that contains several candles. These are starting configurations, not instrument-specific optimisation claims.
- 🖥️ Platform verification: Tested on cTrader Windows. The indicator supports time-based charts below one day; daily, weekly, monthly, Renko, range and tick charts are excluded.
- https://chartshots.spotware.com/c/6acd1cd4a4f26
🔍 How to read the chart
https://chartshots.spotware.com/c/6acd1c891b363
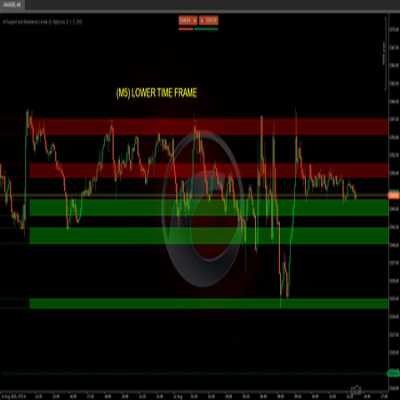
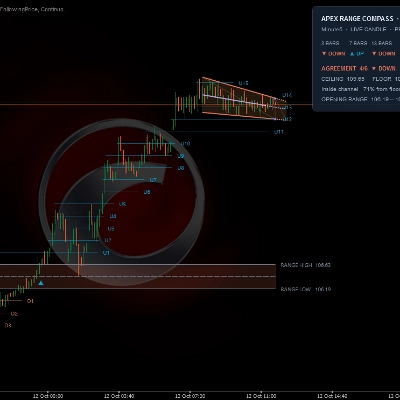
- 📐 Opening range: The indicator records the high and low during your selected opening window. Once the window finishes, RANGE HIGH, RANGE LOW and the centre line provide session reference levels. The zone's positive or negative bias compares its centre with the previous range's centre; it does not describe an active trade.
- 🏹 Range arrows: ▲ marks an upward range breakout; ▼ marks a downward range breakout. Another same-direction signal requires price to return across the range centre to rearm that direction before a new qualifying break.
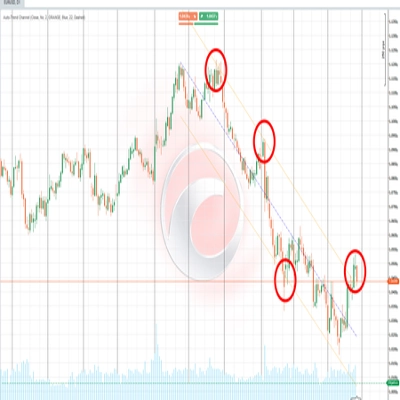
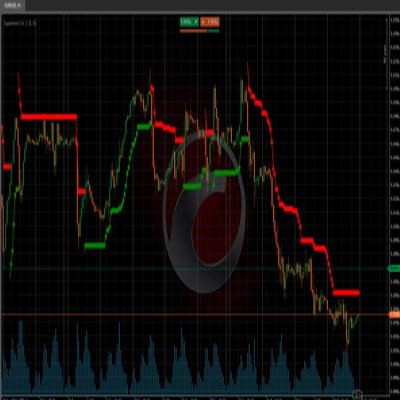
- 📈 Trend channel: The upper boundary is the ceiling and the lower boundary is the floor. The channel adapts to recent price structure and volatility. The forward extension continues its current geometry and can help map areas to watch.
- 🎛️ Six-scale agreement: The panel compares 3, 7, 13, 19, 29 and 47-bar block scales on the selected chart timeframe. For example, 5/6 UP means five scales classify the structure as upward. Agreement describes directional alignment; it does not measure the probability of a profitable trade.
- 📏 Channel position: 0% is the floor and 100% is the ceiling. Above 100% indicates price above the ceiling; below 0% indicates price below the floor. Position is measured within the channel on a normalised price scale.
⚡ Understand the breakout states
Panel state
Practical interpretation
Inside channel
Price is within the current boundaries. Evaluate the range and surrounding structure before choosing a direction.
Breakout above ceiling
Price has moved above the channel. Watch whether the move holds or returns inside.
Breakout below floor
Price has moved below the channel. Watch whether the move holds or returns inside.
Retesting ceiling or floor
After a sufficient move away, price has returned toward the broken boundary while remaining outside. An exact touch is not required.
Confirmed breakout ✓
A tracked retest has been followed by a renewed move away under the indicator's volatility-based rules.
Failed breakout
Price has returned to the boundary or inside the channel after an outside move. Reassess the original breakout setup.
💡 Range arrows describe opening-range breaks. The panel describes structural-channel events. Reading both together adds context to a setup.
🛠️ A practical trading workflow
- ⏰ Set the session: Select the market opening window and its UTC offset. Wait for range capture to finish.
- 🧭 Read the direction: Check the primary channel and six-scale agreement. Mixed readings call for additional confirmation from your trading method.
- 👁️ Watch the break: For a long setup, assess an upward range break alongside upward structure. For a short setup, assess the equivalent downward conditions.
- 🔎 Assess acceptance: Observe price behaviour beyond the relevant boundary and the channel's retest or failure message. A range arrow alone is an event marker, not a complete trade plan.
- 🛡️ Plan risk and objectives: Define your invalidation level, stop-loss and position size before entry. Use the objective ladder as reference levels for your own exit rules.
⚠️ This is an analysis indicator. Trade execution, position sizing and order management remain under the trader's control.
⚙️ Configure the essentials
Setting
What it changes
Window Clock
BrokerDailySession follows broker daily-session boundaries. FixedWindow uses your chosen opening/closing times and fixed UTC offset.
Initial Bucket (Minutes)
In BrokerDailySession mode, capture ends when the next aligned time bucket begins. Default: 30.
Window Opens / Window Closes / Fixed UTC Offset
Used in FixedWindow mode. The default 09:30–09:45, UTC−5 is an example schedule to adapt to your market. Adjust the offset manually when the session's clock changes.
Use Previous Range Bias
When enabled, a breakout against the range bias must cross the first objective level before its marker qualifies. Default: off.
Step as Range Percent
Sets objective spacing. Default 50% means each step equals half the opening-range width.
Objective Trigger
ClosingPrice uses the candle's close value; CandleExtremes uses highs/lows to advance the ladder. In live candles, the close value changes with price.
Ladder Layout
FollowingPrice updates nearby objective segments. FullExtension extends all generated objective lines to the current candle.
Objective Caption Layout
NearbyLevels reduces label crowding. EveryLevel displays all generated objective captions.
Structure Anchor
LiveCandle updates structure during the forming candle. CompletedCandle bases structural analysis on the last completed candle.
Primary Block Span / Comparison Blocks
Defaults: 13 / 5. Larger spans assess broader structure; smaller spans react to shorter moves. The six fixed agreement scales remain unchanged.
Neutral Slope Band (Degrees)
Default: 0.5. A higher value classifies more shallow directional moves as RANGE.
Volatility Window
Default: 20. Sets the lookback used to normalise structural measurements.
Draw Session Baseline
Adds an optional session-reset moving average. Default span: 20, method: Exponential.
Enable Structure Alerts
Enables structural event notifications in LiveCandle mode. Alerts are suppressed in CompletedCandle mode.
💡 For a clear initial layout, keep the panel, channel, opening range and objective ladder visible, and use NearbyLevels captions. Colours, shading, line styles, text size and historical-session display can be adjusted to your chart theme.
🪜 Use the objective ladder correctly
If RANGE HIGH is 100 and RANGE LOW is 90, the range width is 10. At 50% spacing, U1 is 105, U2 is 110, D1 is 85 and D2 is 80. Additional levels appear as price progresses. A displayed objective does not mean that price has reached it or that an order has been placed.
🚀 Before your first session
- ⏱️ Use a chart timeframe small enough to capture the chosen opening window accurately.
- 🕯️ Load at least 236 candles for full default six-scale coverage, or 237 with CompletedCandle selected. Scales awaiting sufficient history can initially display RANGE.
- 🔄 LiveCandle values and markers can change before the candle closes. CompletedCandle applies to the structural analysis; opening-range calculations and the panel's current-price header remain live.
- 📉 Channel boundaries are recalculated as new structure develops. Forward extensions show the continuation of current geometry and do not forecast price.
Summary
Discussion
Customer reviews
5 | 0 % | |
4 | 100 % | |
3 | 0 % | |
2 | 0 % | |
1 | 0 % |