
الوصف
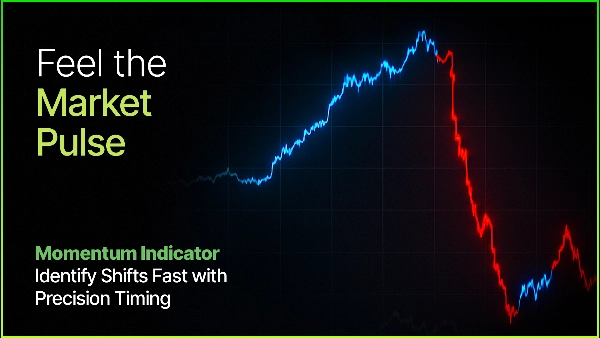
علامة زخم السعة — اكتشاف الاتجاه التكيفي المدعوم بالتقلب
توحّد علامة زخم السعة عدة مفاهيم متقدمة:
- كشف النظام — يحدد مراحل الاتجاه الحقيقية
- تكيّف التقلب — يضبط نفسه وفقًا لظروف السوق الحالية
- VWAP الديناميكي — يبرز مستويات التراجع والاستمرار المهمة
- مقدر فرق الرول — يشير إلى نقاط الدخول المثلى أثناء الاتجاهات
- وحدة التحسين — مع ميزة التحسين الذاتي**
يخلق هذا مؤشرًا ذكيًا يتكيف ذاتيًا ويوفر وضوحًا وقابلية للتكيف ومناطق تداول قابلة للتنفيذ—دون الحاجة لتعديلات يدوية مستمرة.
ما هو؟
علامة زخم السعة هي مؤشر كشف النظام يحدد متى يدخل السوق أو يخرج من مراحل الزخم الصاعد أو الهابط—في الوقت الحقيقي.
على عكس تقاطعات المتوسطات المتحركة التقليدية، يقيس تحولات الزخم الفعلية من خلال تقييم إزاحة السعر وقوة الانعكاس.
السؤال الأساسي
هل السوق حاليًا في مرحلة زخم—وفي أي اتجاه؟
للإجابة على ذلك، يتتبع المؤشر:
- السعة — مدى تحرك السعر؛
- التسلسل — الترتيب الذي تحدث به القمم والقيعان.
يشير التحرك القوي يليه انعكاس مهم إلى بداية نظام زخم جديد.
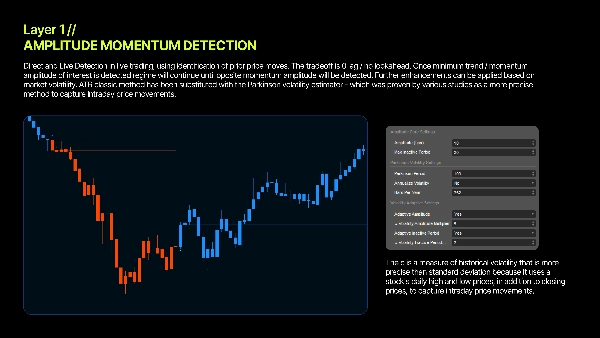
كيف يعمل
1. قياس التأرجح
يقوم المؤشر بتحديث أقصى وأدنى أسعار باستمرار.
فرقهم—السعة— يحدد حجم التأرجح الحالي للسوق.
2. كشف الانعكاس
- انخفاض حاد يليه ارتفاع قوي → **زخم صاعد**
- ارتفاع حاد يليه انخفاض قوي → **زخم هابط**
3. تأكيد الأهمية
فقط الانعكاسات التي تتجاوز عتبة معدلة بالتقلب تُفعّل إشارة صالحة.
4. كشف النفاد
إذا توقف السعر عن التقدم، يحدد المؤشر نفاد الزخم ويعود إلى الحياد.
تقلب باركنسون — عتبات تكيفية
تستخدم معظم المؤشرات معايير ثابتة. هذا المؤشر يتكيف تلقائيًا. باستخدام تقلب باركنسون— الذي يدمج نطاقات القمم والقيعان داخل اليوم—يضبط المؤشر الحساسية بناءً على ظروف السوق الحقيقية. النتيجة: أداء متسق عبر البيئات الهادئة والمتقلبة. ( مثبت إحصائيًا أكثر كفاءة من طريقة ATR )
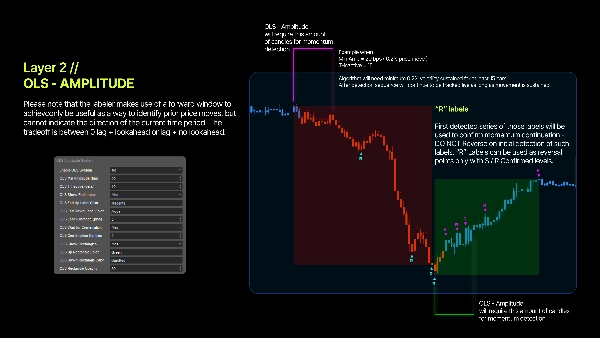
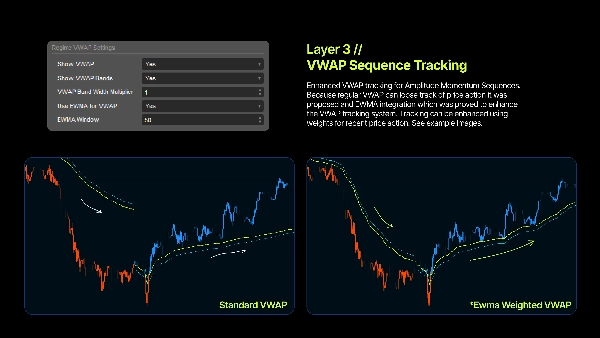
VWAP النظامي — مستويات ديناميكية لإعادة الدخول
بمجرد تفعيل النظام، يحسب المؤشر VWAP خاصًا بذلك الاتجاه، موفرًا مستويات دعم ومقاومة ديناميكية. تعتمد المؤسسات بشكل كبير على VWAP، وغالبًا ما يتفاعل السعر حوله—مما يجعله مثاليًا لدخول التراجعات.
وضع EWMA
قم بتمكين EWMA لإعطاء أوزان أكبر للأسعار الحديثة، مما يخلق منحنى VWAP أكثر سلاسة واستجابة. ممتاز لتحديد إعادة الدخول أثناء الاتجاهات الممتدة.
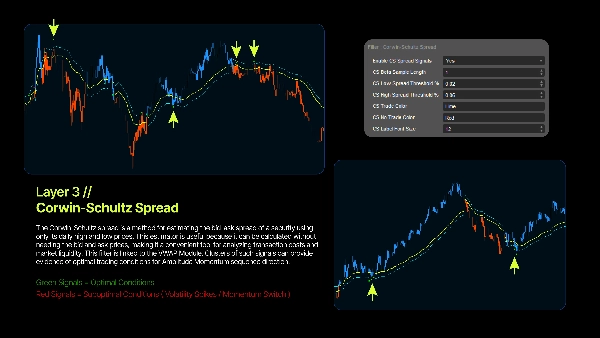
مقدر فرق الرول - مرشح ديناميكي لإعادة الدخول
مقدر فرق الرول هو طريقة لتقدير فرق العرض والطلب من أسعار التداول المرصودة، عادة باستخدام التغاير التسلسلي لتغيرات السعر. طورها رول، وتفترض أن التداولات المتعاقبة تتناوب بين أسعار العرض والطلب، وأن المعلومات الجديدة لا تحرك السعر "الحقيقي" باستمرار. رغم بساطتها وأساسيتها، تم تحسين الطريقة الأصلية لمعالجة مشكلات مثل الانحياز النزولي والأداء الضعيف في مجموعات بيانات معينة. يعتمد المقدر على فكرة أنه إذا لم تُصدر معلومات جديدة، ستتأرجح الأسعار ببساطة بين العرض والطلب. ويفترض احتمالًا متساويًا لتداولات الشراء والبيع.
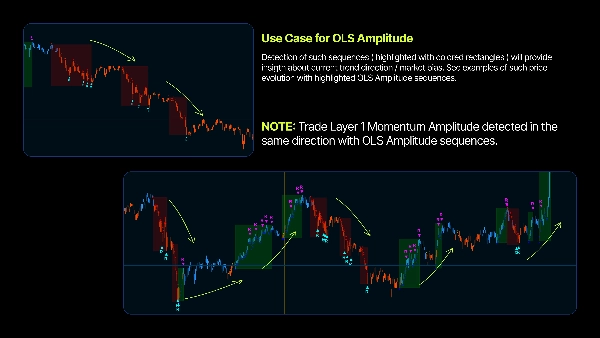
فوائد الاستخدام
1. تحديد الاتجاه الموضوعي - لا خطوط اتجاه. لا تخمين. الرياضيات تحدد النظام.
2. تكيف مع التقلب - يضبط تلقائيًا مع تغير الظروف باستخدام تقلب باركنسون.
3. مناطق دخول واضحة - تساعد مستويات VWAP النظامي في تحديد مناطق التراجع والإضافة بوضوح.
4. حدود نظام محددة - تعرف بالضبط متى يبدأ الزخم ومتى ينتهي.
5. توافق متعدد الأطر الزمنية - يضمن التطبيع بنقاط الأساس سلوكًا متسقًا على أي مخطط.
الأساس الكمي
العوائد اللوغاريتمية
يضمن استخدام العوائد اللوغاريتمية التماثل، مما يجعل قياس الزخم قويًا رياضيًا.
نقاط الأساس
تستخدم جميع الحسابات وحدات نقاط الأساس الموحدة (1 نقطة أساس = 0.01%)، مما يسمح بتناسق عبر الأصول.
كشف التراجع
يتم تحديد تحولات الزخم من خلال تحركات اتجاهية قوية تليها تحركات معاكسة ذات معنى (انعكاسات على شكل V).
الحجم الاصطناعي
يضمن الحجم الاصطناعي المبني على النطاق والجسم دقة VWAP لأي رمز.
⎽⎽⎽⎽⎽⎽⎽⎽⎽⎽⎽⎽⎽⎽⎽⎽⎽⎽⎽⎽⎽⎽⎽⎽⎽⎽⎽⎽⎽⎽⎽⎽⎽⎽⎽⎽⎽⎽⎽⎽⎽⎽⎽⎽⎽⎽⎽⎽⎽⎽⎽⎽⎽⎽⎽⎽⎽⎽⎽⎽⎽⎽⎽⎽⎽⎽⎽⎽⎽⎽⎽⎽⎽⎽⎽⎽⎽⎽⎽⎽⎽⎽⎽⎽⎽⎽⎽⎽⎽⎽⎽⎽⎽⎽⎽⎽⎽⎽⎽⎽⎽⎽⎽⎽⎽⎽⎽⎽⎽⎽⎽⎽⎽
هذه الأداة لأغراض تعليمية ومعلوماتية فقط. ليست نصيحة استثمارية. التداول ينطوي على مخاطر، وقد تتجاوز الخسائر الودائع. الأداء السابق لا يضمن النتائج المستقبلية. أنت المسؤول الوحيد عن جميع قرارات التداول. المنشئ غير مسؤول عن أي خسائر مالية ناتجة عن استخدام المؤشر. قم دائمًا بإجراء تحليلك الخاص قبل التداول.
الملخص
Key features include:
- **Regime Detection:** Pinpoints market entry and exit points for momentum trends.
- **Volatility Adaptation:** Uses Parkinson Volatility to self-tune sensitivity based on current market conditions, ensuring consistent performance across varying volatility.
- **Dynamic VWAP:** Calculates a volume-weighted average price specific to each trend regime, providing dynamic support and resistance levels for pullback and continuation entries.
- **Roll Spread Estimator:** Estimates bid-ask spreads to signal optimal re-entry points during trends.
- **Self-Optimization Module:** Automatically adjusts parameters without manual intervention.
The indicator operates by continuously tracking price extremes to measure swing amplitude, detecting significant reversals that exceed volatility-adjusted thresholds, and identifying momentum exhaustion when price progression stalls. It uses logarithmic returns and basis-point normalization for mathematically robust, cross-asset consistency. Synthetic volume calculations enhance VWAP accuracy across symbols.
This tool supports multiple markets including Forex, stocks, indices, commodities, and cryptocurrencies, and is compatible with various timeframes. It outputs visual signals and filters to assist traders in objective trend identification and clear entry zone determination.
تقييمات العملاء
5 | 75 % | |
4 | 25 % | |
3 | 0 % | |
2 | 0 % | |
1 | 0 % |


![شعار "[Hamster-Coder] Pivot Points MTF"](https://cdn.ctrader.com/image/webp/4c143e5a-309c-40e3-a578-f04d1e133ffa_31159)


