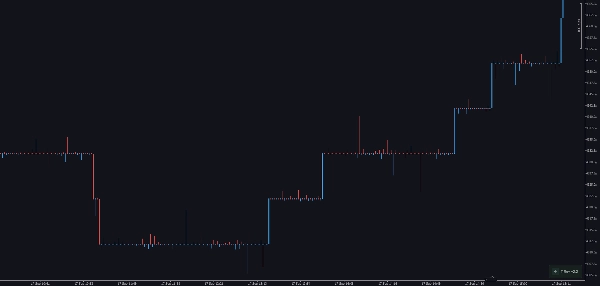
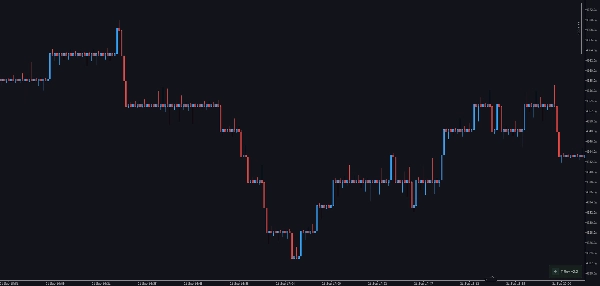
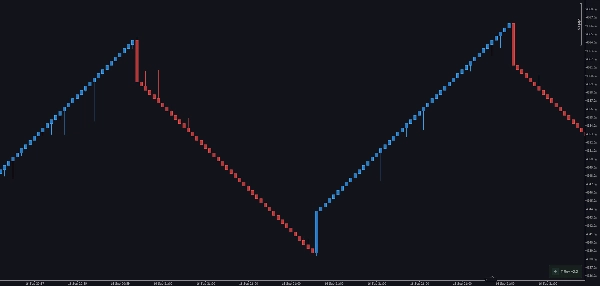
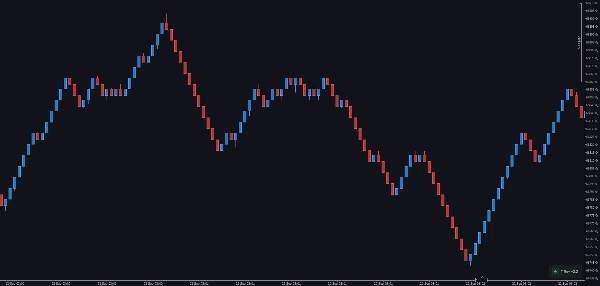
Descrição
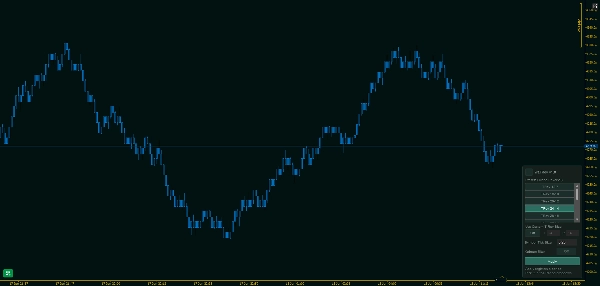
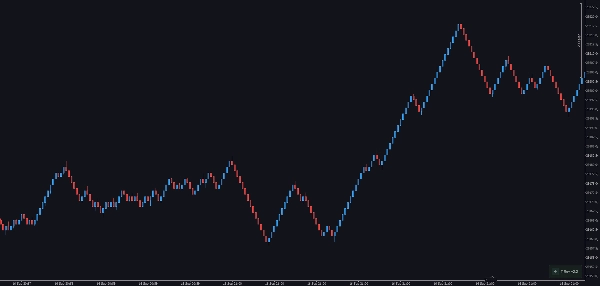
Os gráficos Trend Reversal (TRev) plotam velas de acordo com a distância que o preço se move, não com a passagem do tempo.
Nesse sentido, eles estão relacionados aos gráficos Point & Figure (P&F) — mas onde uma única coluna P&F representa uma tendência inteira até que o preço reverta, um gráfico TRev mostra uma tendência contínua como uma série de velas.
Isso ocorre porque em um gráfico TRev uma nova vela se forma toda vez que o preço se move um número definido de ticks em qualquer direção — então um movimento prolongado imprime múltiplas velas de tendência uma após a outra, dando uma visão muito mais detalhada de como uma tendência se desenvolve.
Para o guia de uso do plugin e do Painel no gráfico - por favor, consulte a Apresentação em Vídeo do "Plugin de Timeframes Personalizados", pois segue os mesmos usos / métodos.
Velas de Tendência e Reversão
Como nos gráficos P&F, os gráficos TRev contêm dois tipos de velas.
- Velas de reversão se formam da mesma forma que em um gráfico P&F: uma nova vela é plotada quando o preço se move um número definido de ticks contra a direção atual (o tamanho da reversão).
- Velas de tendência são onde o TRev difere do P&F: uma nova vela de tendência se forma toda vez que o preço continua na mesma direção por um número definido de ticks (o tamanho da tendência).
Você configura dois valores — o tamanho da tendência e o tamanho da reversão. Por convenção, o tamanho da tendência é aproximadamente 1,68 × o tamanho da reversão, embora você possa usar qualquer proporção.
Exemplo:
Suponha que você defina um tamanho de reversão de 500 ticks, dando um tamanho de tendência de 840 (500 × 1,68 ≈ 840):
O preço está subindo, então reverte 500 ticks → uma nova vela de reversão é plotada.
O preço continua subindo 840 ticks → uma nova vela de tendência é plotada.
Por que as velas TRev têm pavio apenas de um lado
Olhe para um gráfico TRev e você notará que cada vela tem um pavio apenas no lado da abertura. Isso decorre diretamente de como as velas são construídas. Pegue uma vela verde (de alta). Em uma vela normal baseada no tempo, um pavio no lado da abertura significa que o preço caiu abaixo da abertura, e um pavio no lado do fechamento significa que o preço subiu acima do fechamento. Em uma vela verde TRev:
Um pavio no lado da abertura pode se formar — isso significa que o preço caiu, mas não pelo tamanho total da reversão (ex: 500 ticks) necessário para iniciar uma nova vela de reversão. Um pavio no lado do fechamento não pode se formar — a vela só fecha quando o preço percorre o tamanho da tendência (ex: 840 ticks) a partir da abertura. O preço não pode ultrapassar e voltar dentro da mesma vela, porque no momento em que atinge 840 ticks, uma nova vela de tendência começa. Velas vermelhas (de baixa) seguem a mesma regra espelhada: o pavio fica no lado da abertura (superior), e a mínima é o fechamento.
Escolhendo um gráfico TRev no Plugin
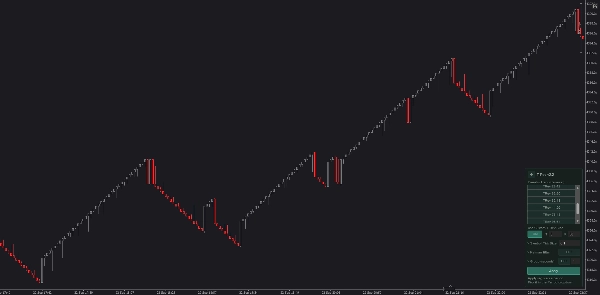
Este plugin adiciona períodos TRev ao menu suspenso normal de Períodos do cTrader, e oferece um painel de controle no gráfico para criá-los. Tanto no nome do período quanto no painel, o primeiro número é o tamanho da tendência e o segundo número é o tamanho da reversão — por exemplo, 16-10 significa tendência 16, reversão 10.
Cada nome de período codifica tudo que define as barras, na forma:
[símbolo:]{tendência}-{reversão} - {tamanho do tick} - {K|O}
onde K = filtro Kalman ativo e O = Original (bruto, Kalman desligado). Por exemplo, XAU:16-10 - 0.25 - K é um TRev Kalman em XAU, tendência 16, reversão 10, tamanho do tick 0.25.
Você pode definir o período rotacional de uma vela TRev de duas maneiras:
- Escolha um predefinido. O painel lista os pares padrão de tendência-reversão em uma lista rolável. Com a chave Usar Tamanho T-Rev Personalizado definida como Desligado, o predefinido destacado é usado.
- Digite intervalos personalizados. Defina a chave Usar Tamanho T-Rev Personalizado como Ligado e digite seus próprios valores de Tendência (T) e Reversão (R) na mesma linha.
De qualquer forma, pressione Aplicar para registrar o período. Ele então aparece no menu suspenso de Períodos do cTrader, pronto para ser selecionado.
Predefinições disponíveis
As predefinições incorporadas (tendência-reversão) são: 12 - 7 // 16 - 10 // 20 - 12 // 24 - 14 // 28 - 16 // 28 - 14 // 28 - 12 // 32 - 20 // 32 - 18 // 44 - 26 // 78 - 48 // 96 - 64 // 120 - 82 // 210 - 125
Opções adicionais
Tamanho do Tick do Símbolo — o tamanho do tick usado para toda a matemática de limiar, definido diretamente no painel. Esse valor é sempre aplicado, então as distâncias de tendência e reversão são medidas em incrementos de preço consistentes independentemente do tick nativo do instrumento. Faz parte do nome do período.
Filtro Kalman (Desligado/Ligado) — um removedor opcional de ruído de preço. Quando ligado, o preço bruto é suavizado antes que o limiar de tendência/reversão seja testado, para que picos de tick único não fechem uma vela prematuramente. O OHLC da vela sempre acompanha o preço bruto; apenas o momento em que a vela fecha é afetado. No nome do período, Kalman ligado é marcado como K e Kalman desligado é marcado como O (Original), então os dois são períodos distintos que você pode executar lado a lado.
Quebra no Fim do Dia (EOD) — opcionalmente reinicia a formação da vela no início de cada novo dia de negociação.
Benefícios dos Gráficos TRev
Como os gráficos P&F, os gráficos TRev facilitam ver onde o preço permanece em uma faixa por um tempo significativo. Ao eliminar o ruído das flutuações menores baseadas no tempo, eles tornam tendências e reversões muito mais óbvias.
Quando você vê um agrupamento de velas de reversão uma após a outra, isso marca uma área turbulenta no mercado — um sinal de absorção ou distribuição. Essas zonas se destacam claramente em um gráfico TRev, o que torna a identificação de suporte e resistência mais direta.
Absorção refere-se a níveis de preço onde um grande volume negocia tanto no lado de compra quanto no de venda sem que o preço se mova substancialmente — essencialmente onde os participantes do mercado se encontram e fazem a maior parte de suas negociações sem pressionar o mercado, deixando compradores e vendedores satisfeitos.
Resumo
TRev charts feature two candle types: reversal candles, which form when price reverses by a set tick amount, and trending candles, which form when price continues in the same direction by a set tick amount. Users configure both trend size and reversal size, with a typical trend size approximately 1.68 times the reversal size. Each candle has a wick only on its opening side, reflecting the unique formation rules.
The plugin integrates TRev periods into cTrader’s period dropdown and includes an on-chart control panel for selecting presets or entering custom trend and reversal sizes. Additional options include setting symbol tick size, applying a Kalman filter for price smoothing, and restarting candle formation at the start of each trading day.
TRev charts help identify price ranges, trends, reversals, and zones of absorption or distribution by filtering out minor time-based fluctuations, aiding in clearer support and resistance analysis.













![Logótipo de "Custom Timeframes [Iridio Capital]"](https://cdn.ctrader.com/image/webp/4d75a920-23c7-4fea-a7b5-594a9d067f2e_63286)